It was hugely volatile last week across forex, stocks and commodities. Were you caught by surprise?
While some might have predicted that new US tariffs would cause stocks to drop, I doubt many expected the speed of the decline (volatility). On the other hand, I think nobody would have predicted that tariffs would cause a big drop in the US dollar nor the speed of the moves in the forex market.
Our team also didn’t predict it either - and that’s because we didn’t try to! How could we have won in these volatile markets when we (like most) didn’t predict them? Because we had a plan, and we stuck to it.
Weekly thoughts
Of course, not every trade entry results in a profit- that’s the same for us as anybody.
Take for example our NOK/USD idea. The daily chart produced a breakout over resistance but it was a fakie and reversed 2 days later. For breakout trades a stop loss should ideally be placed under the breakout area. But a quick review of the recent week’s analysis demonstrates we had some huge winners.
Sticking with the forex market, NZD/JPY was our focus in week 12 and we suggested fading rebounds over 86.00. The market got up to 87 and promptly slammed 600 pips lower to 81.
In week 11, we talked about a ‘new era for euro bulls’ and outlined EUR/AUD to buy on a pullback ahead of a likely breakout - which happened with gusto last week as the price surged a massive 1200 pips from the lows around 1.71 to the peak around 1.83.
Turning to the stock market. Last week - the ‘unlucky’ week 13 - we outlined the completed double top in U30/USD. While the market price was still up at 41,500, we stated the downside objective of the pattern was 39,000. It overshot our target in one week and finished under 38,100.
Going back to week 12, we talked about when to get contrarian - and used the apparent exhaustion in DAX 40 (D40/EUR) as our example. We outlined the break below a triangle pattern around 22,400 as the trigger for a much larger drop. The DAX closed last week nearly 2000 points below that under 20,500.
Even going back to week 11, we covered Nasdaq and said while we were cautiously bullish overall, we wouldn’t go long against the downtrend on the daily chart then outlined a weekly close below a rising trendline (which happened the week before last) as a reason to get bearish.
So how were we able to position for these huge moves last week without expecting them? Because we had a plan, and stuck to it.
Take those trades we just ran through. Any one of them could have failed. Some did—like NOK/USD. Others might’ve taken weeks to play out, or never triggered at all. But when we put the plan in place—based on price structure, technical patterns, or market sentiment—we also define what invalidates the idea. That’s the stop. And just as importantly, we define what validates it: where and when we’ll enter, how we’ll manage it, and what type of follow-through we need to see.
The beauty of last week wasn’t just in the gains—it was in the clarity. In a volatile environment, that clarity is gold. You don’t need to guess or react emotionally. The setups were there, the levels were clear, and our job was simply to execute.
Some weeks, like week 13, everything lines up. Breakouts follow through, patterns complete, reversals stick. Other times, the setups fizzle, or take longer to mature. But by showing up with a structured approach each week—reviewing the same charts, applying the same methodology—we give ourselves a consistent edge.
And that’s the real win: being in position. We can’t control the outcome of any one trade. But we can control how we engage with the market. And with a plan, we ensure that when the market does move—whether it’s in 24 hours or over the course of several weeks—we’re not chasing, we’re participating.
Weekly setups and signals
We look at hundreds of charts each week and present you with three of our favourite setups and signals. For more setups, please get in touch with us.
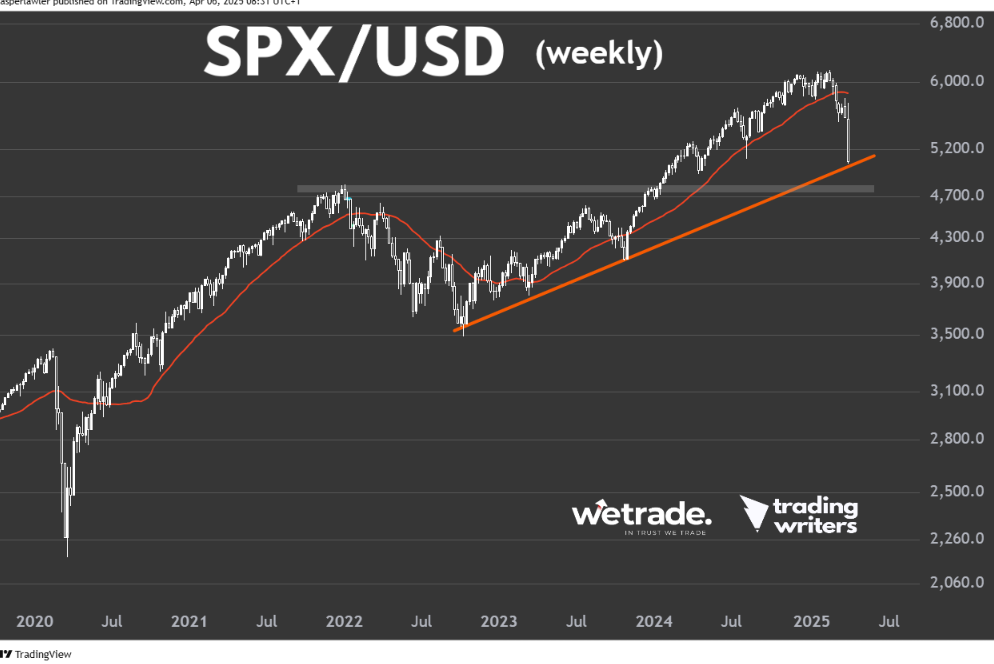
SPX/USD
Long term chart (weekly)
Trend: Down
Phase: First leg lower in new downtrend
Resistance = 6,000
Support = 4,800
Price action:
After treading water below the 30 week SMA, the S&P 500 got hammered last week in what we consider the first leg of a new downtrend. A rising trendline plus the 5000 round number could see some temporary relief before the selling ensues.
View: Bearish while under the 30 SMA
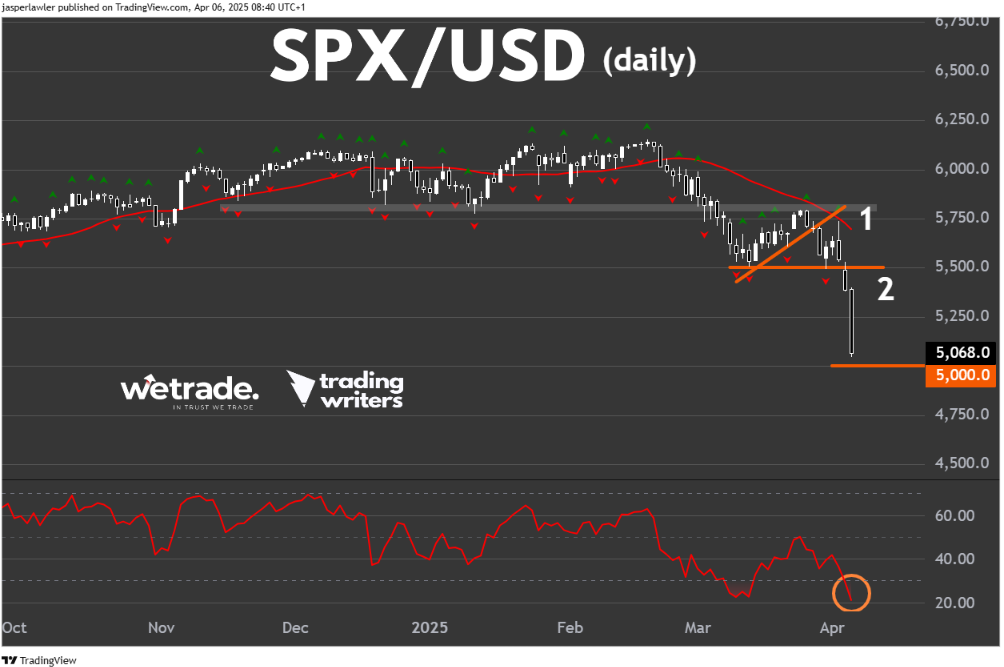
Medium term chart (daily)
Trend: Down
Phase: Oversold
Resistance = 5,500
Support = 0.092
Price action: The daily chart shows the two previously available entry points on a ‘breakdown trade’ as ‘1’ and ‘2’. At this stage, there is no new such setup. In such a fast moving market, a break below a fractal low or the formation of a fractal high could be be setups to get short.
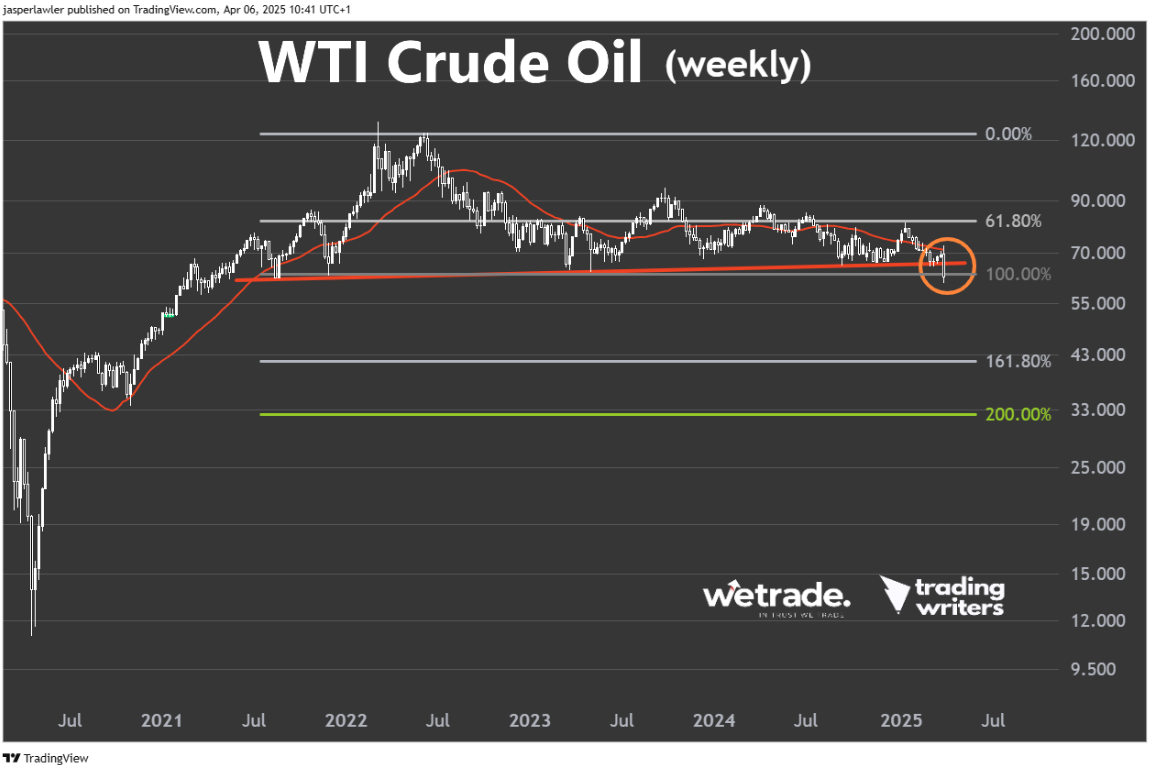
US Oil (USO/USD)
Long term chart (weekly)
Trend: Sideways
Phase: Completed top pattern
Resistance = 70,000
Support = 50,000
Price action: The price has made a decisive break and weekly close below the long term flat rising trendline. We consider this a bearish sign that signals a new bear market. The long term objectives of this completed pattern could be as far as $43 and $33.
View: Bearish while below 70,000
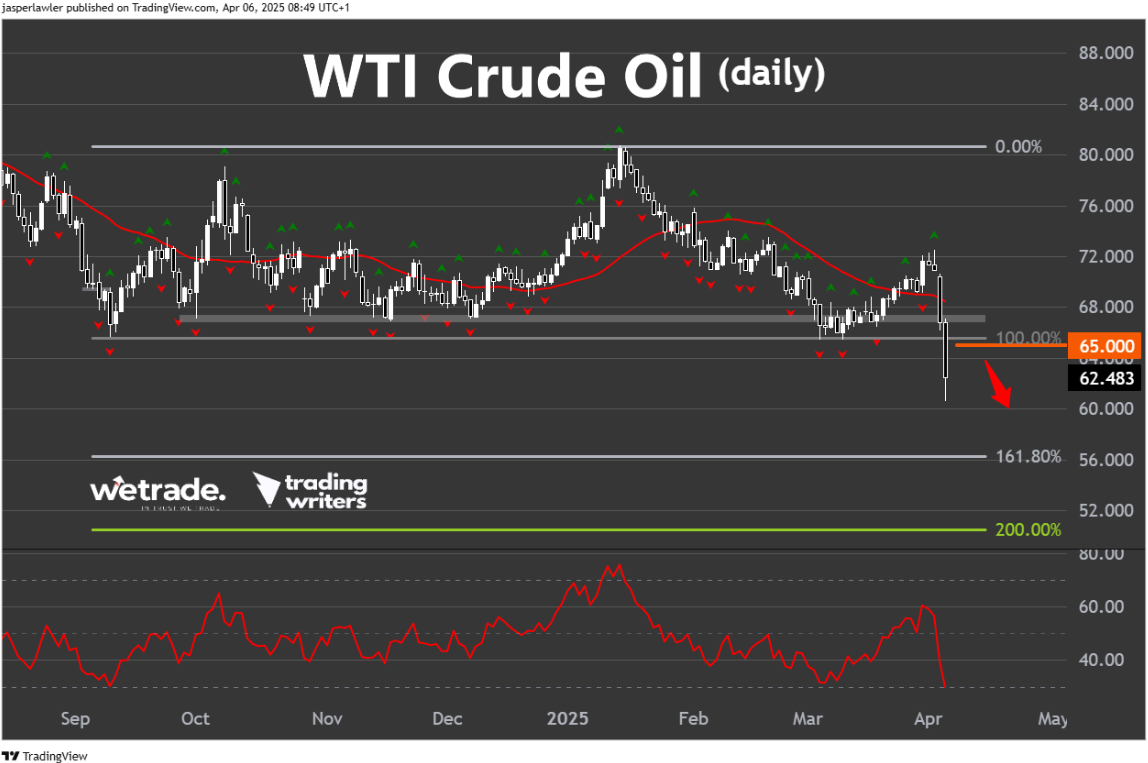
Medium term chart (daily)
Trend: Down
Phase: First breakdown
Resistance = $65
Support = $56
Price action: The breakdown through horizontal support could see the height of the prior range as a downside objective, with $56 the first and the second coming in close to the round number of $50.
NZD/USD
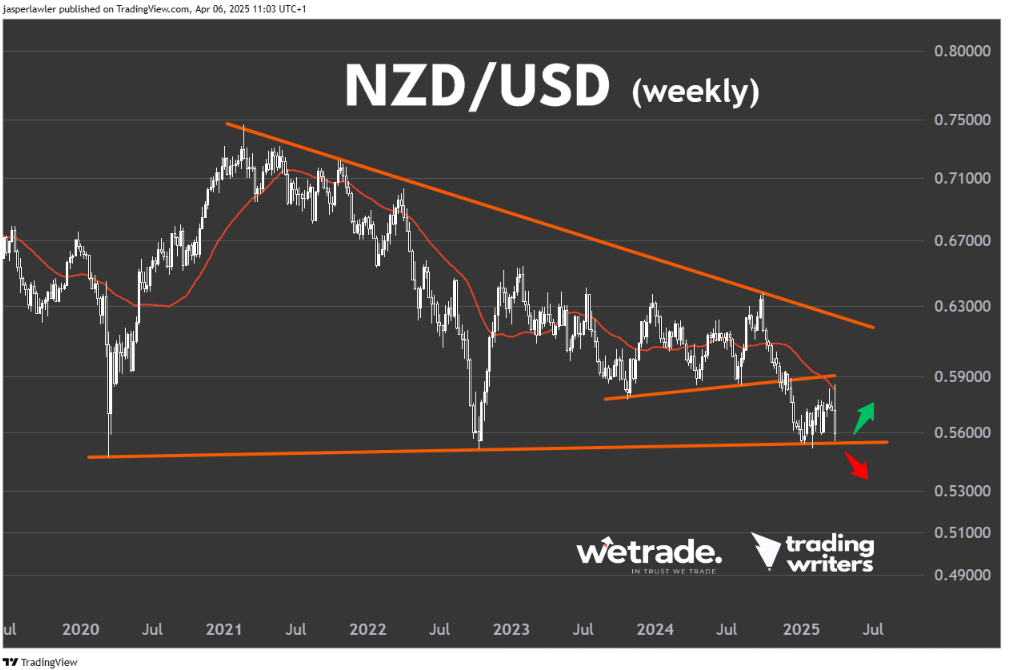
Long term chart (weekly)
Trend: Down
Phase: Consolidation
Resistance = 0.59
Support = 0.49
Price action: NZD/USD held the critical long term support level at 0.56 after a huge bout of dollar strength on Friday. A break below the long term uptrend line could extend the downtrend toward the 2009 lows at 0.49.
View: Bearish once the uptrend line is broken
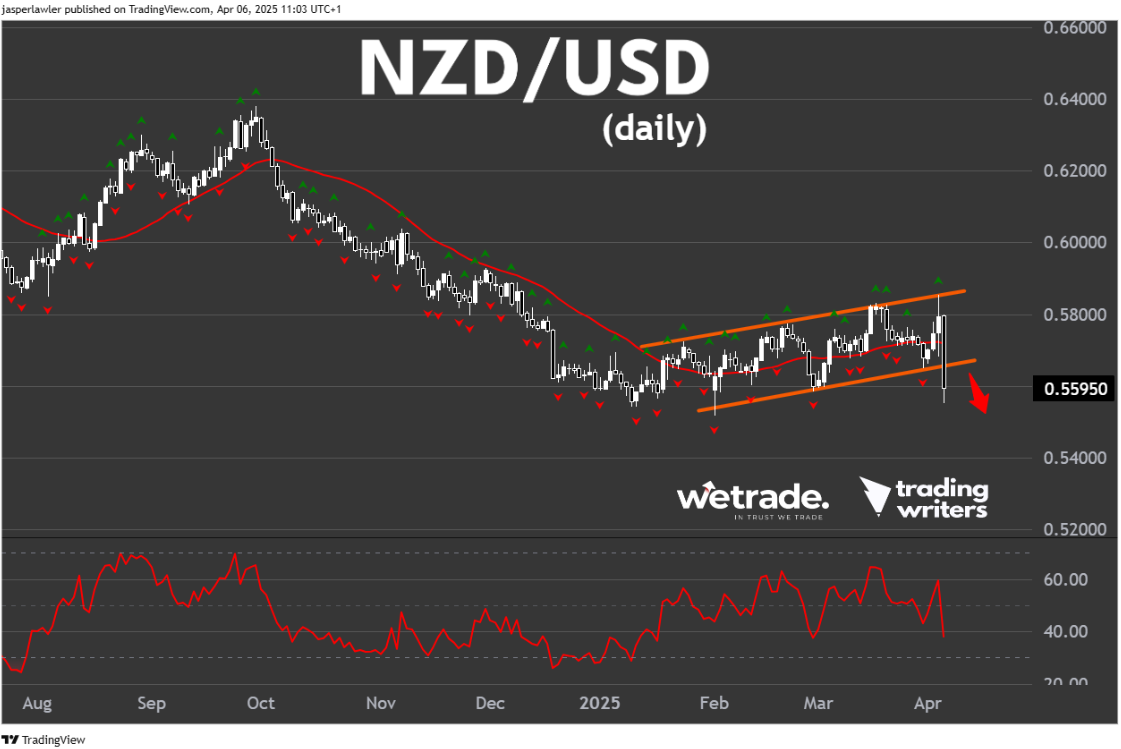
Medium term chart (daily)
Trend: Down
Phase: Bear flag breakdown
Resistance = 0.56
Support = 0.55
Price action: The price has broken down from a bear flag pattern but is yet to put in a definitive break below the long term low. Momentum is to the downside but trades might need to manage chop near the lows.
But - as always - that’s just how the team and I are seeing things, what do you think?
Share your ideas with us - OR - send us a request!
Trade with WeTrade!
Every position closed is one step closer to unlocking WeTrade Honours privileges and redeeming exclusive rewards.
Start your trading journey here - Register now
Kickstart your trading of the week here - Login Now