The best trades always look so obvious in the rearview mirror.
You can look at where a huge price move began - and it’s almost always a breakout from a very obvious level of support or resistance.
But when you’re live trading - things never seem to feel that obvious!
Many traders as they see the breakout happening, they:
1. Enter the trade but get nervous waiting for a slow move and close out too soon
2. Wait to get more confirmation and miss out on a fast move
We see both of these happening in crude oil markets.
WTI Crude Oil (USOUSD)
For a ‘bit of fun’ in our last weekly technical analysis of 2024, we have included two versions of the weekly chart in WTI crude oil (shown as USOUSD on the WeTrade platform) - I know we are a bit crazy.
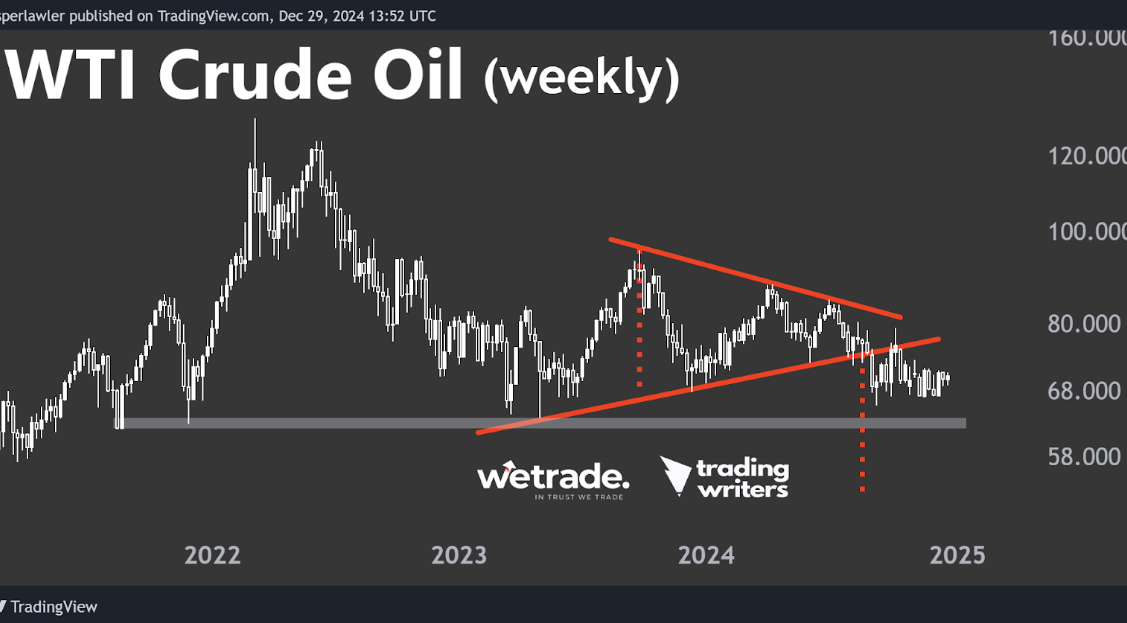
Weekly chart - version 1
We published this same triangle pattern back in week 37 and there still has not been a major move lower since the breakout.
This is scenario A written above. Anybody who sold short the breakout of this triangle several weeks ago will be sitting on a trade that is basically flat.
The trade has not failed - but there is a big opportunity cost to tying up your money in a trade that goes nowhere. So it’s pretty tempting and possibly a good idea to close it out and look for another opportunity.
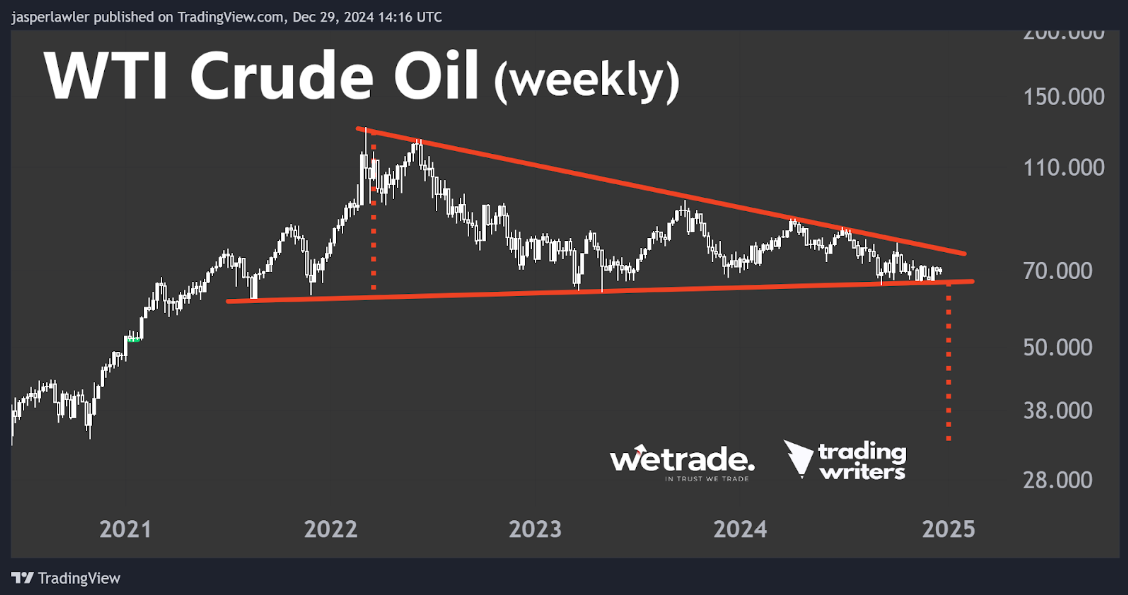
Weekly chart - version 2
We think our zoomed out version 2 of the weekly chart for WTI crude best explains the lack of downside progress since the breakout.
There is a much bigger triangle pattern at work - and price is yet to break down from it - and indeed could break above it in the coming year.
We think if this triangle support breaks, crude oil could offer one of the best trading opportunities of the year with a fast-moving downtrend to ride lower.
Using the height of this triangle pattern as a downside objective, the price could get down to $30 per barrel.
And if that did happen - wouldn’t it look so obvious in the rearview mirror!
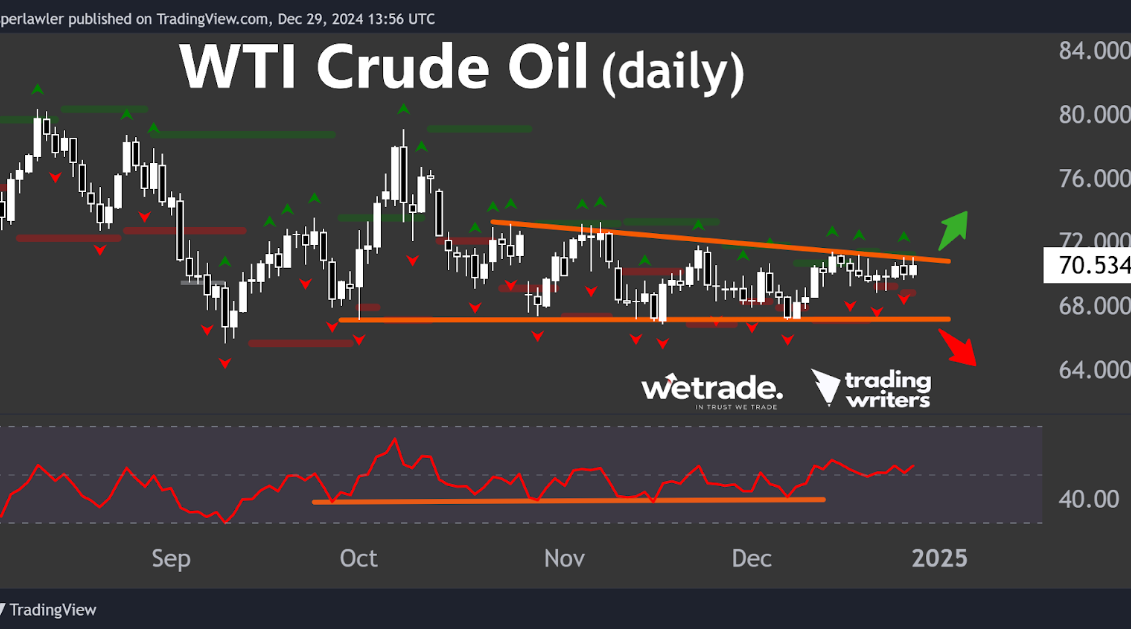
Down on the daily chart, price is in yet another - smaller - triangle pattern.
At the moment, as price tests the upper trendline of the pattern and with RSI holding above of oversold territory - an upside breakout actually looks more likely (but is not yet confirmed).
A move lower and a break below the support level around $67 would offer a short term catalyst to trade in line with our long term bearish opportunity.
Gold
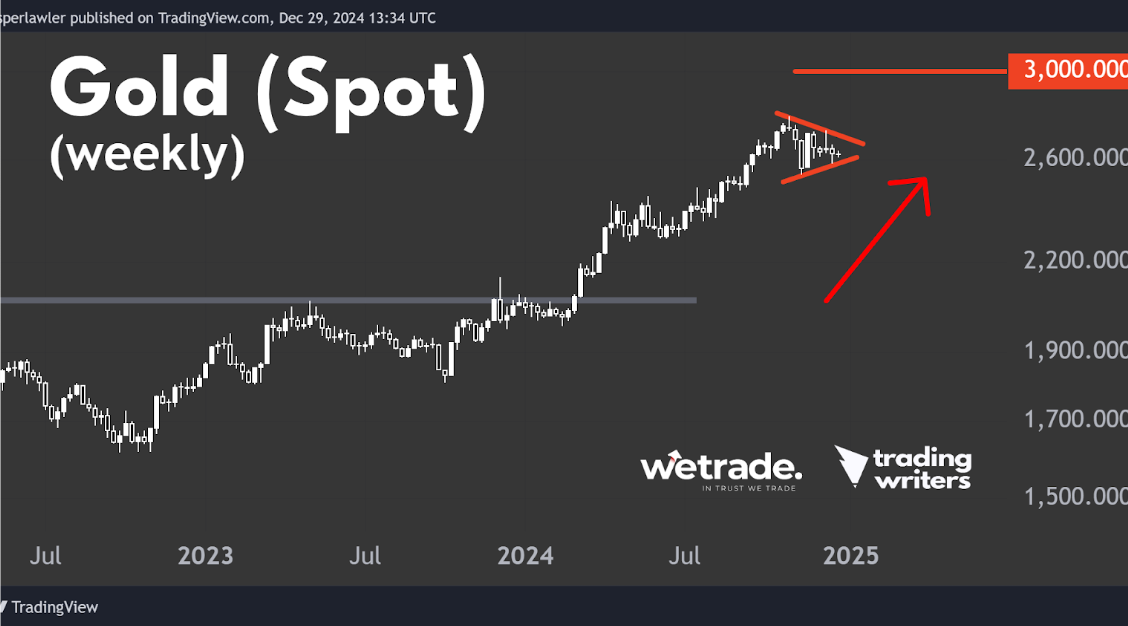
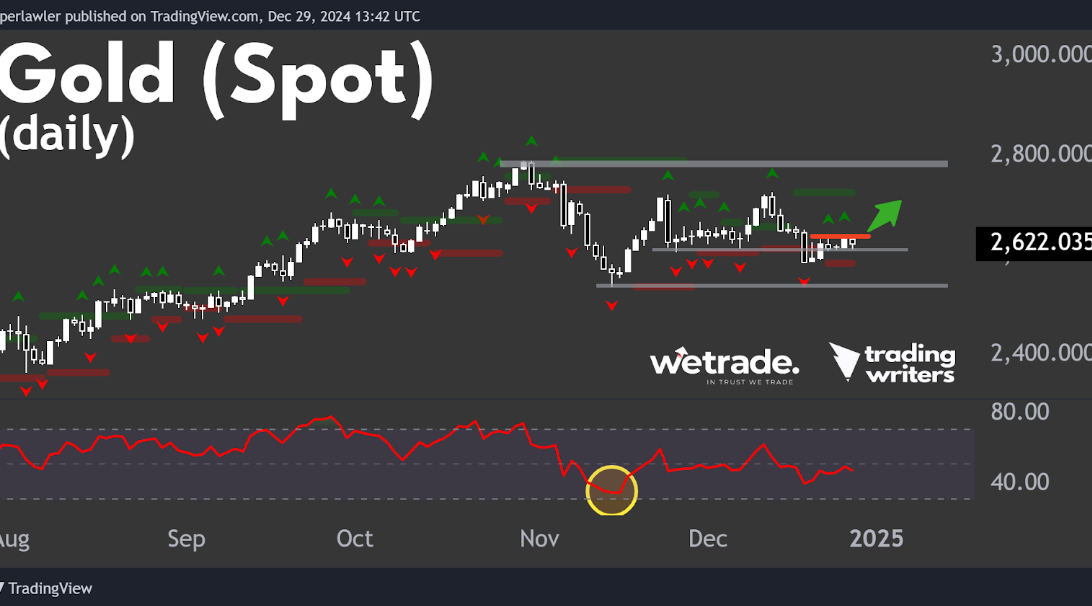
On a long term chart, the other main commodity - gold - still looks very bullish - but with admittedly a lot more room to pullback.
The weekly chart shows the long uptrend with the last few weeks printing a bull pennant pattern.
The daily chart shows the RSI indicator having avoided oversold territory, suggesting the sideways consolidation will eventually resolve higher.
However, for now, the price is trading in an 80% band below the high and above the low set in October and November respectively.
A failed breakout below the lower threshold of this 80% band could be the first sign of renewed bullish interest in gold.
A breakout over the matching upper fractals could offer an opportunity to get long in the short term and a possible early entry point before the breakout of the weekly bull pennant.
AUD/USD
For long time readers of our analysis, you have probably seen that the idea is to take a view about the direction of the market in the weekly chart and then look for trades on the daily chart.
We have found this gives us an extra edge - and higher winning % - than traders only using the daily chart for entry signals.
But we don’t always get that weekly direction right.
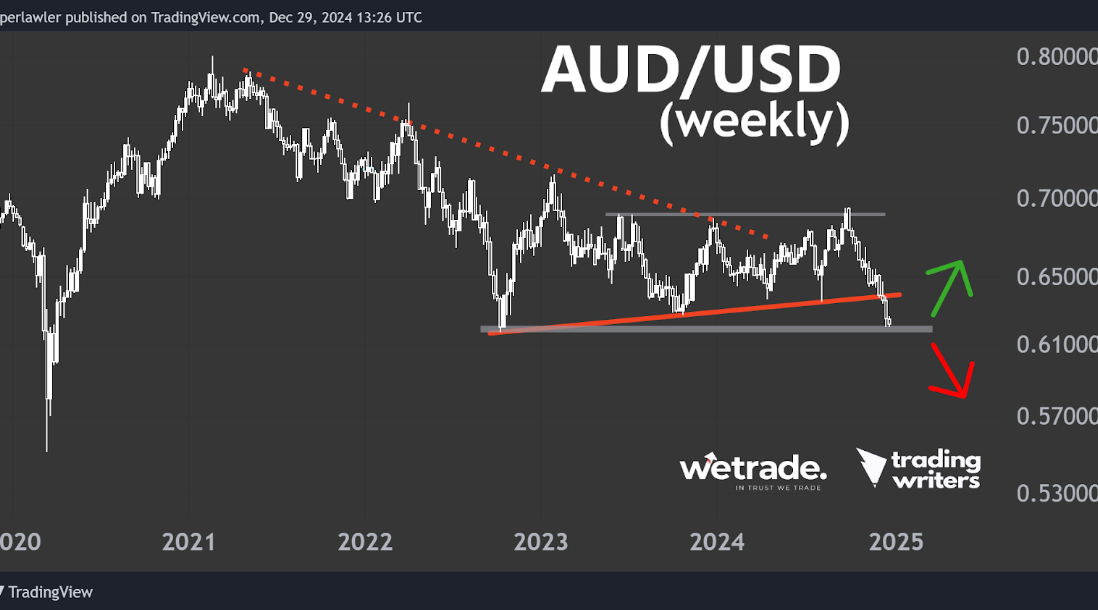
The last time we looked at the AUD/USD in week 40’s analysis, we were trading the breakout of the down trendline and range breakout.
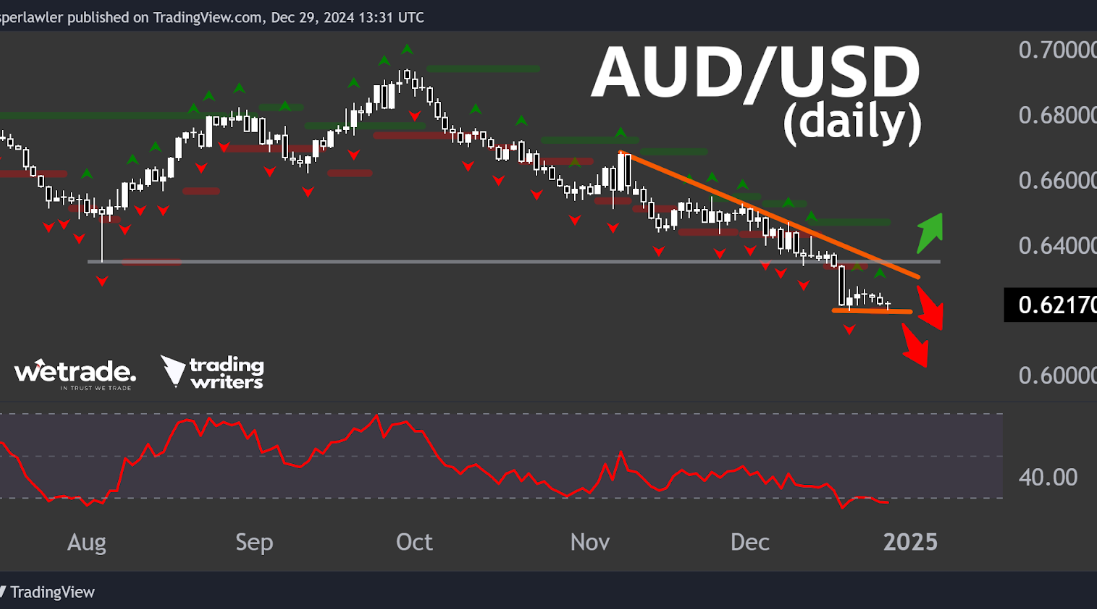
As it happens, there was a fakeout and the price fell like a rock down to current levels and major long term support.
The downtrend on the daily chart keeps our bias bearish for now. But should the price break back over former support (around 0.63) and the short term down trendline - that could be a sign that the long term support level is holding for now.
But that’s just how the team and I are seeing things, what do you think?
Send us a message and let us know how you plan to trade these markets.
Thanks very much for reading our analysis in 2024. We’re planning bigger and better things in 2025 so stay tuned and Happy New Year!
Trade with WeTrade!
Every position closed is one step closer to unlocking WeTrade Honours privileges and redeeming exclusive rewards.
Start your trading journey here - Register now
Kickstart your trading of the week here - Login Now
Produced by Jasper and the Trading Writers team in collaboration with WeTrade.


