(USD/JPY | Gold | UK 100)
USD/JPY
Quick refresher: To ‘fade’ a price move is to trade against it.
Put simply you sell when the price is moving up or buy when the price is going down.
That might sound like counter-trend trading. But it isn’t quite the same. We like trend-following. Buying when price is rising and selling when price is falling. So we would never suggest a counter trend trade.
The way you can follow the trend and ‘fade’ a price move is using multiple timeframe analysis (what we do every week with a weekly and daily chart).
The idea is to sell an uptrend on the daily chart, which is actually a correction within a downtrend on the weekly chart.
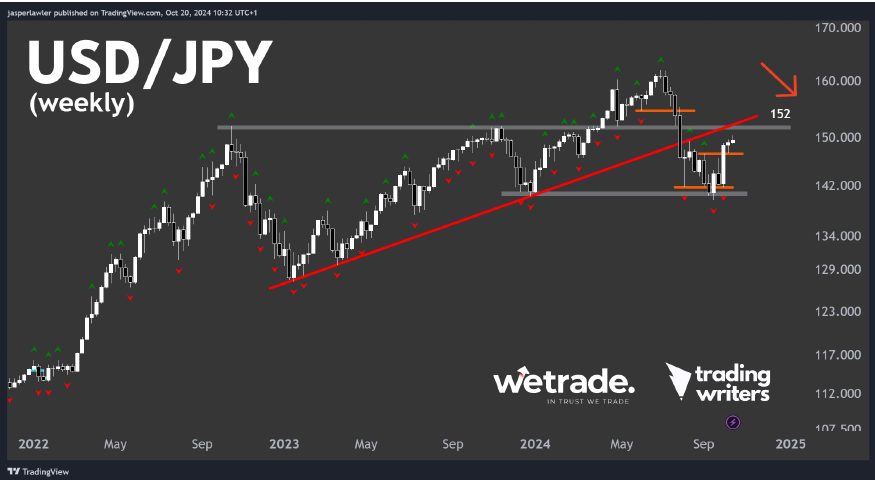
Looking at USD/JPY on the weekly chart, to our analysis it looks like the uptrend has broken and a new downtrend has begun.
An area of resistance to this downtrend is the matching highs at 152.
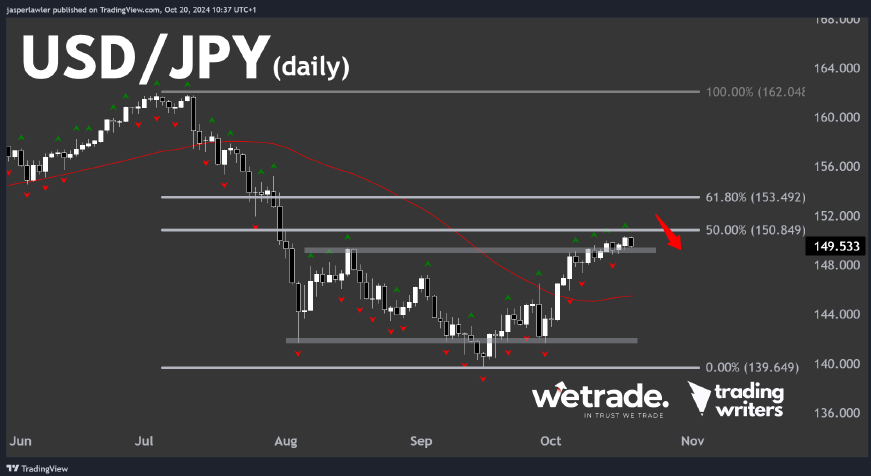
On the daily timeframe we see a series of rising fractals with the price moving up and away from the 50 DMA.
The golden pocket (the price zone between the 50% and 61.8% Fibonacci retracements) comes in right around 152 - matching our weekly resistance.
As such, we will be waiting for a downward reversal from this zone around 152. Should it happen, a daily close below the latest lower fractal would be added confirmation that it was right to ‘fade’ this daily uptrend in USD/JPY.
Gold
In week 39, we asked: is historic upside coming in Silver? Last week’s breakout would suggest the answer is YES.
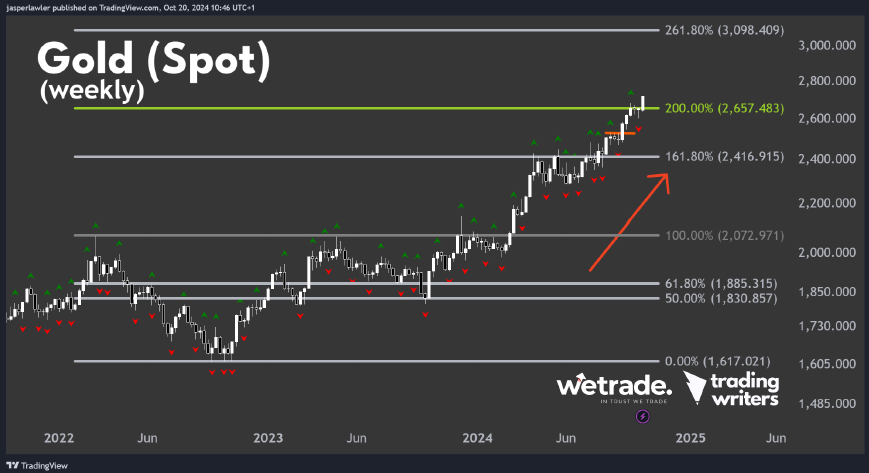
And while we are walking down memory lane, in week 38 we defined two possible upside targets in gold. The first one (the 200% Fibonacci extension) was almost the exact midpoint of the recent two week consolidation. Now that price has broken out again, it leaves the next major price objective at the 261.8% Fib extension at ~3100.
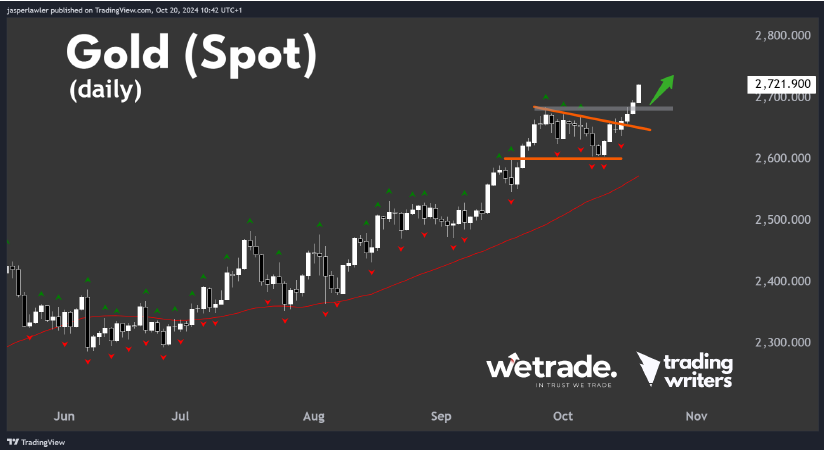
On the daily chart, we see the breakout of a triangle pattern with a first ever close above $2700.
That makes $2800 then $3000 the major round number objectives.
Any pullbacks in gold should be supported by the just broken high at 2680 or re-test of the former triangle resistance.
A daily close below 2600 would mean an end to the short-term uptrend.
UK 100
It’s hard to find ‘bargains’ in equity indices when most developed markets are posting record highs.
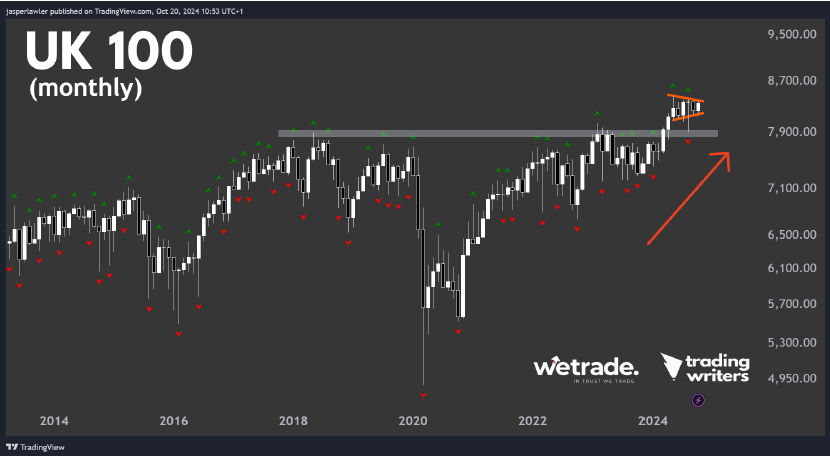
One place that has yet to hit record high territory is the United Kingdom. The King of England’s FTSE 100 index is consolidating in a 6-month contracting range.
The general pattern in markets is that price moves from trend to range to trend again. That’s why breakouts can work so well as a trading strategy.
There was one false break to the downside that tested multi-year resistance at 7900 as support, suggesting the next breakout attempt should be to the upside.
And if other equity indices keep trending higher, it makes sense the UK 100 will have to play some catchup.
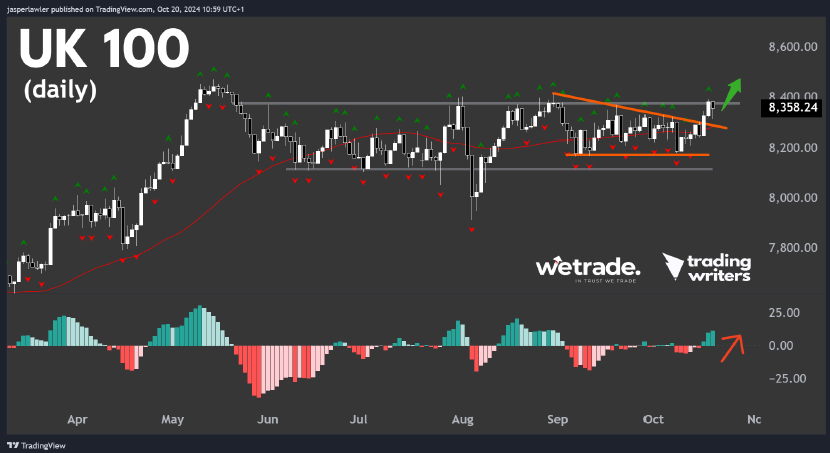
On the daily chart we see the choppy price range between about 8100 and 8400. We can also see a triangle formation, which has broken to the upside.
As long as the top of the triangle holds as support, there is reason to think the price can break out to a new record high and begin a major new uptrend for the UK 100.
But that’s just what we think, do you agree or disagree? Send us a message and let us know
Happy Trading!
Trade with WeTrade!
Every position closed is one step closer to unlocking WeTrade Honours privileges and redeeming exclusive rewards.
Start your trading journey here - Register now
Kickstart your trading of the week here - Login Now
Produced by Jasper and the Trading Writers team in collaboration with WeTrade.


