GBP/USD
Fractals anybody?
We’ve reintroduced ‘fractals’ into our regular analysis.
FYI you can find this in this in the MT4 platform by navigating to:
<Insert> <Indicators> <Bill Williams> <Fractals>
In truth, we’ve been using them all along - because fractals are simply a way to identify ‘swing highs’ and ‘swing lows’.
That’s because, as we know, higher highs and lows make an uptrend and lower lows and highs make a downtrend - and when neither or both are happening - it’s a sideways trend.
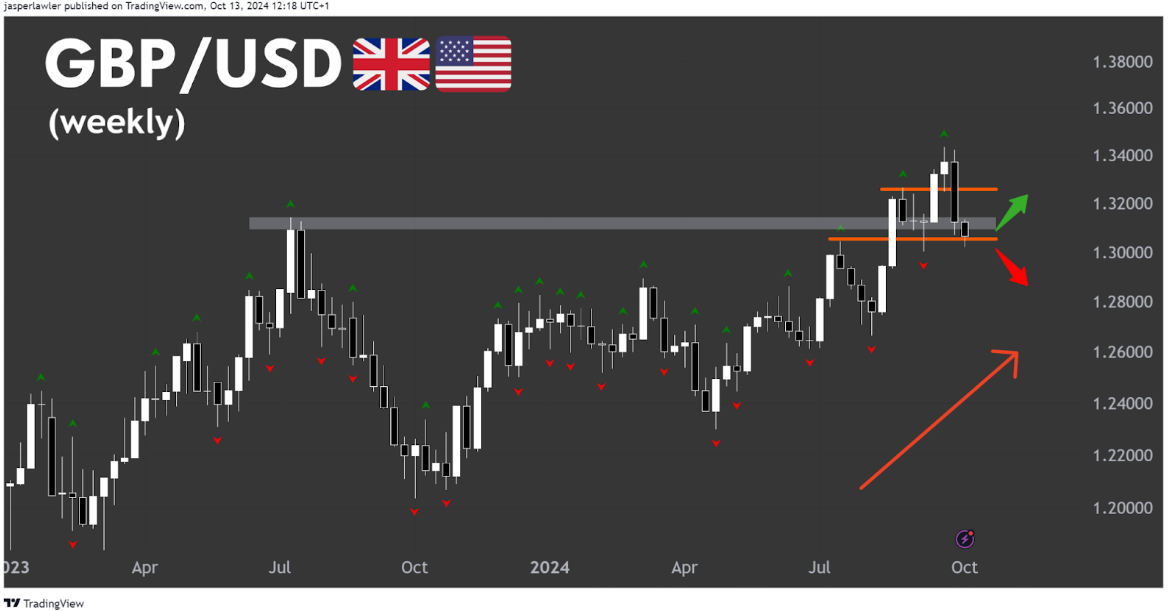
For GBP/USD - weekly fractals are trending higher
BUT there has been a large bearish weekly engulfing candlestick.
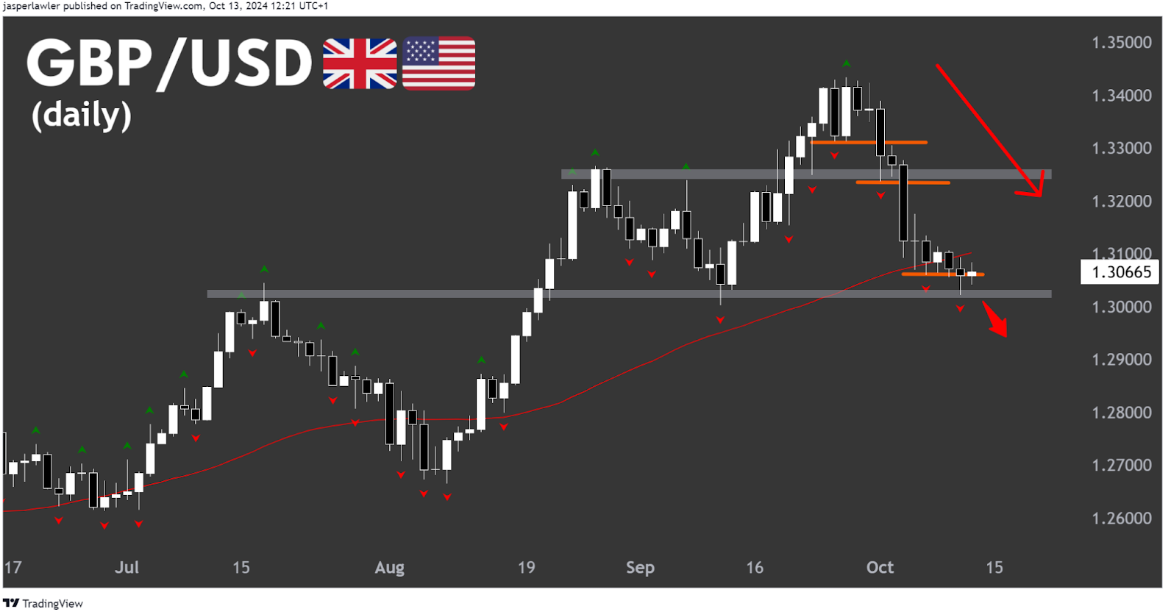
Dropping down to the daily chart, we see the weekly bearish engulfing as a steep correction with two lower fractal breaks. A third lower fractal break would coincide with a move below the 1.30 round number.
This to us would indicate a major US dollar comeback and a clear end to the GBP uptrend (and probably the EUR/USD uptrend too.. See next below)
There is still a chance for a bullish bounce but there is no swing high (shown by an upper fractal) yet to judge this on.
For now, the bearish break would be confirmed by a close below 1.30 / support for a move that could target the last major swing low at 1.27.
EUR/USD
The euro looks softer than Sterling.
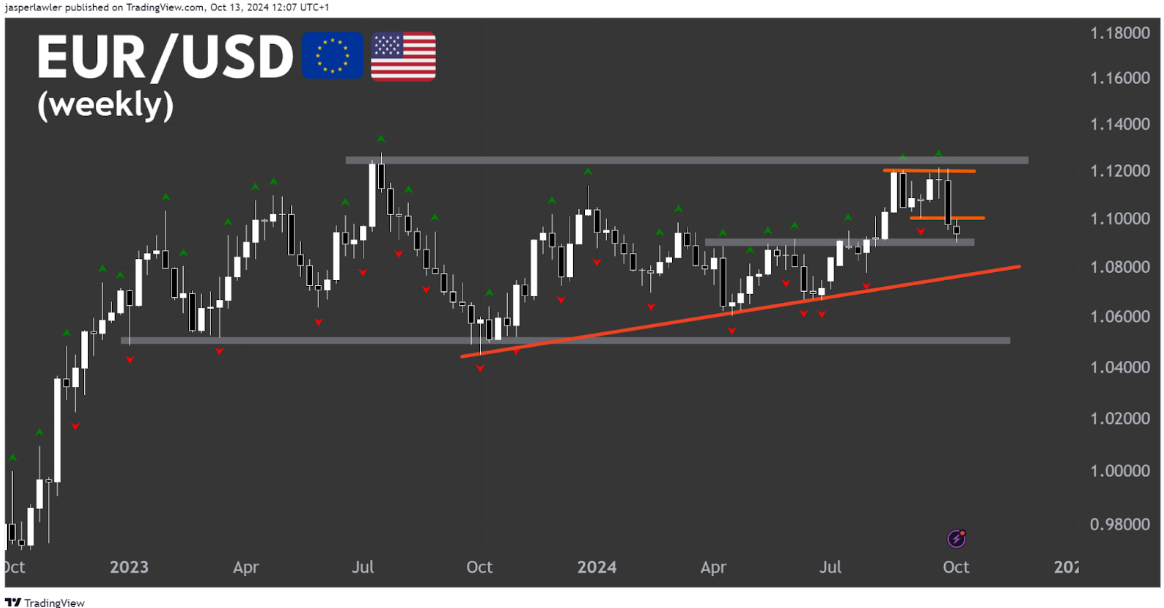
EUR/USD failed to break (or even test) key resistance above 1.12 and has formed a double top pattern with two matching higher fractals.
EUR has already formed a lower low on the weekly chart and broken below its big round number at 1.10 (neither of which has happened to GBP).
Price now sits at the former resistance-turned-support zone around 1.09.
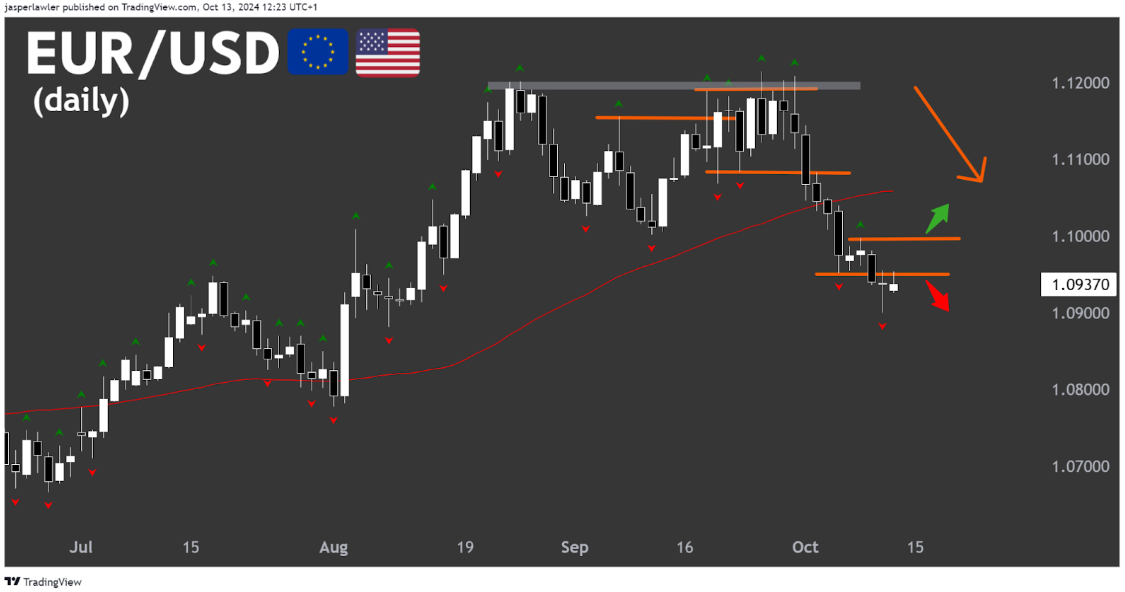
On the daily chart, a long-legged doji candlestick pattern formed after the break below the last lower fractal. This is a weak break that is more likely to see a bullish reversal.
A daily close below 1.09 would confirm the bearish action, while a close back over the last upper fractal at 1.10 would imply the correction has ended.
Silver (XAG/USD)
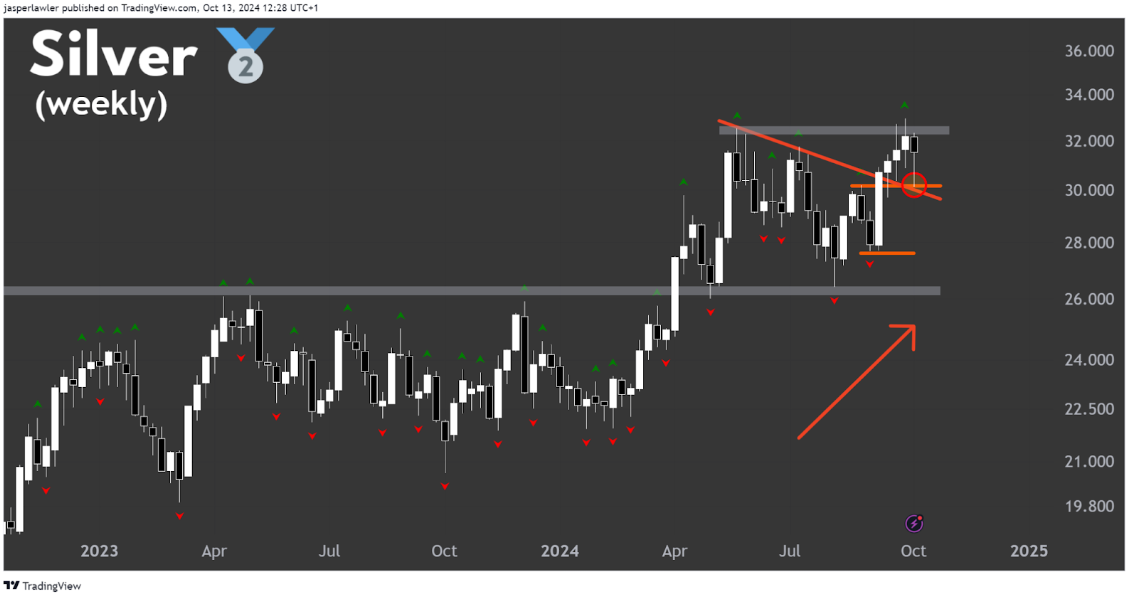
Silver hasn’t closed above its former high from May - but it has made a second weekly close above it. Closing prices are ultimately what matters.
The hammer candlestick pattern formed last week that rebounded off a confluence of support from the last upper fractal and the broken down trendline suggests the breakout will happen soon - perhaps this coming week.
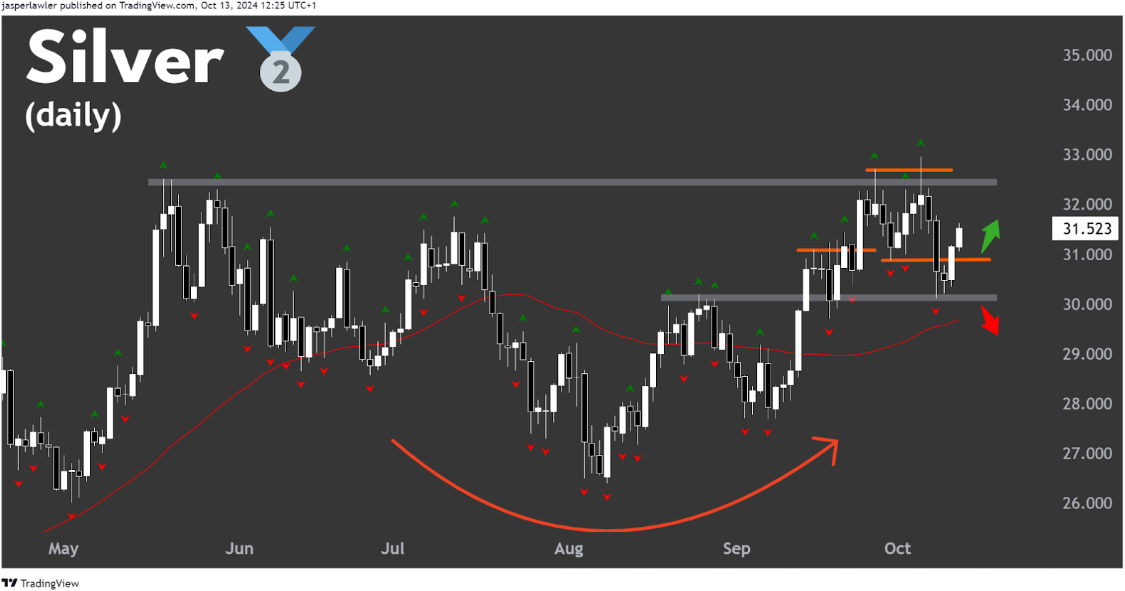
The daily chart for silver shows that one lower fractal was made as part of a correction of the bullish trend.
That was followed by a bullish engulfing pattern that saw follow-through the next day.
The bullish trend will be on solid footing while above 31.0 but a break back below 30.0 would indicate a bigger correction back into the old trading range.
But that’s just what we think, do you agree or disagree?
Send us a message and let us know.
Happy Trading!
Trade with WeTrade!
Every position closed is one step closer to unlocking WeTrade Honours privileges and redeeming exclusive rewards.
Start your trading journey here - Register now
Kickstart your trading of the week here - Login Now
Produced by Jasper and the Trading Writers team in collaboration with WeTrade.


