Gold
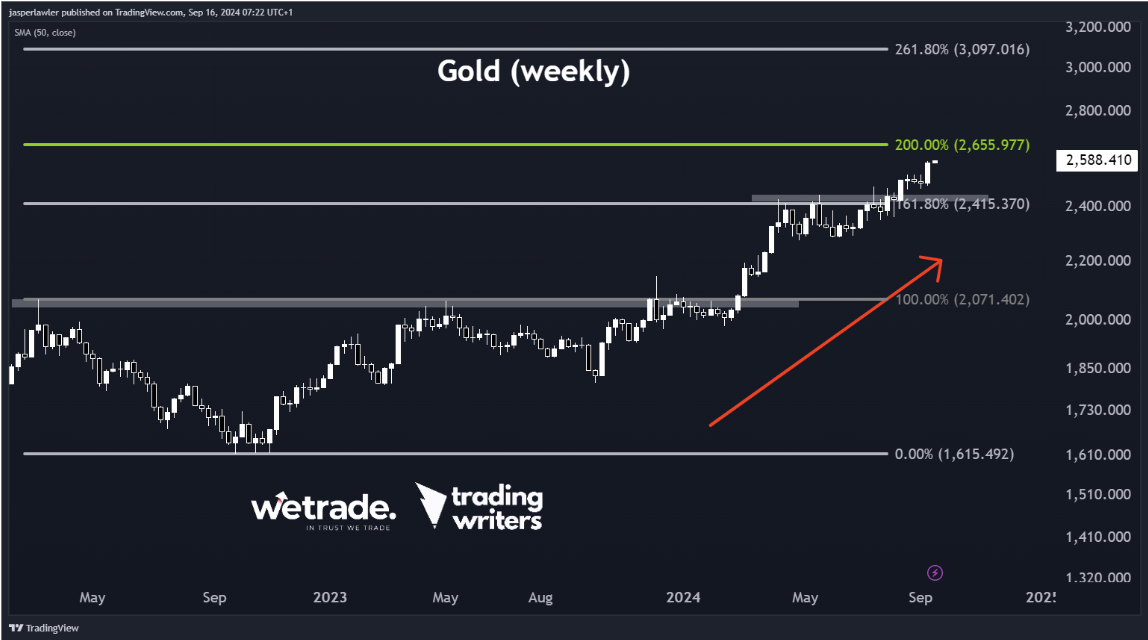
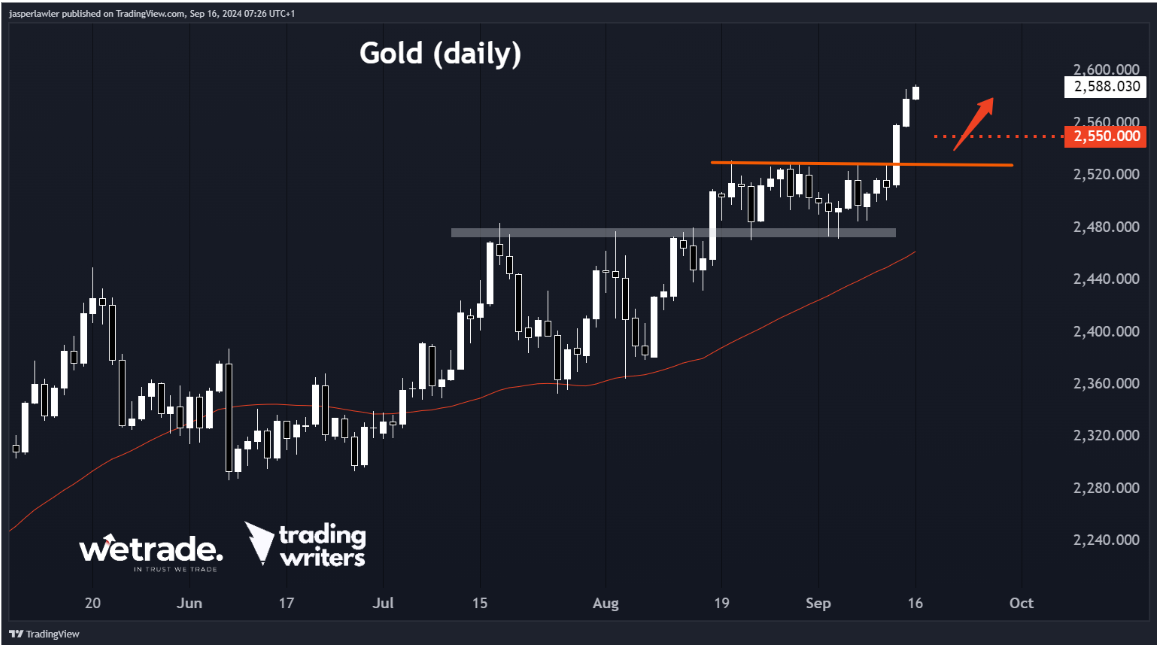
Gold broke out again last week after a 3-week rest.
You can visually see gold traders ‘taking a breather’ with 3x weekly doji candlesticks.
Last week was the breakout - again - and notice how much quicker it took to break out this time versus the multi-month sideways action that started in May and lasted through August.
This is a much more bullish market now and bulls have less patience to get positions on.
But where do we go from here, if there is no resistance above a record high?
A tool we have found a lot of success with is the Fibonacci extension.
Do you see how the 161.8% extension called the top of the 4-month range we just mentioned?
The 200% extension, i.e. not just retracing all of the moves lower but then doubling it - comes in at 2655. The 261.8% is the big one - that would get us over 3000 (3K!!).
Given the bullish nature of this market, we’d be surprised to see gold retest former highs at 2520 but if it did that would be the first natural support.
But somewhere between 2520 (support) and 2550 (interim round number) could offer a good risk: reward for a move up to our first target at 2655.
EUR/USD
Notice how gold and the euro are both breaking higher?
We talked about this the other week, but no harm in repeating important ideas. The US dollar is WEAK.
And it's probably no coincidence that the Federal Reserve is deciding interest rates this week - and most economists expect them to cut interest rates - which all else being equal - is bearish for the US dollar.
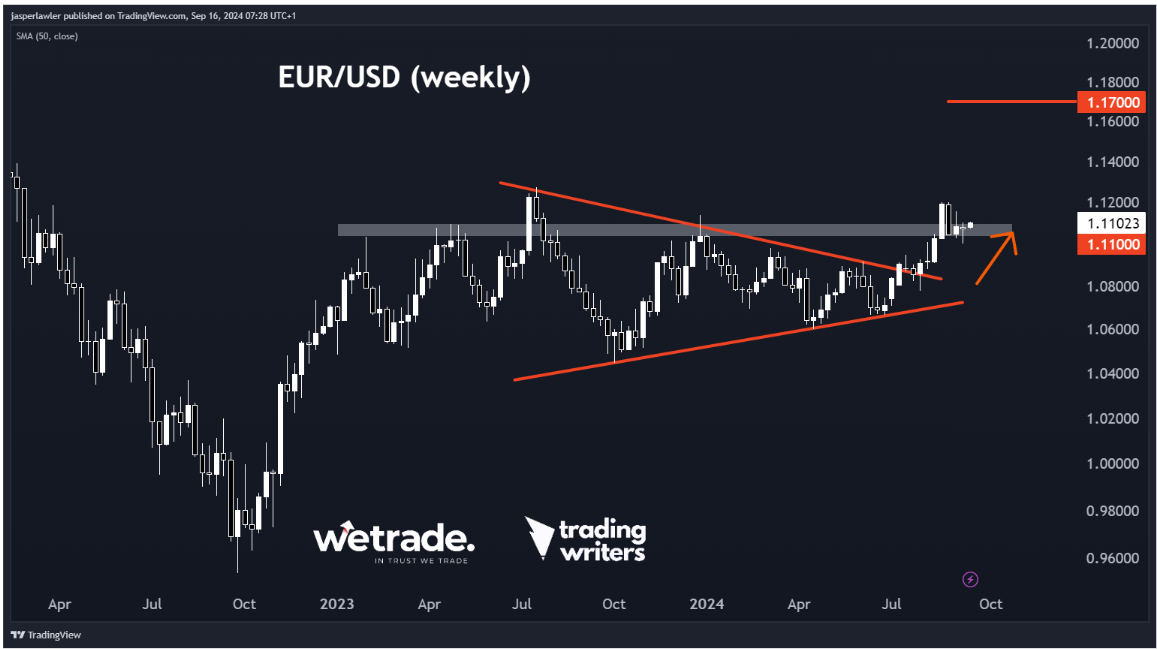
The EUR/USD has been bullish in our view since its breakout of a long-term triangle pattern.
The major overhead resistance was at 1.11 - this is now being tested as support after breaking.
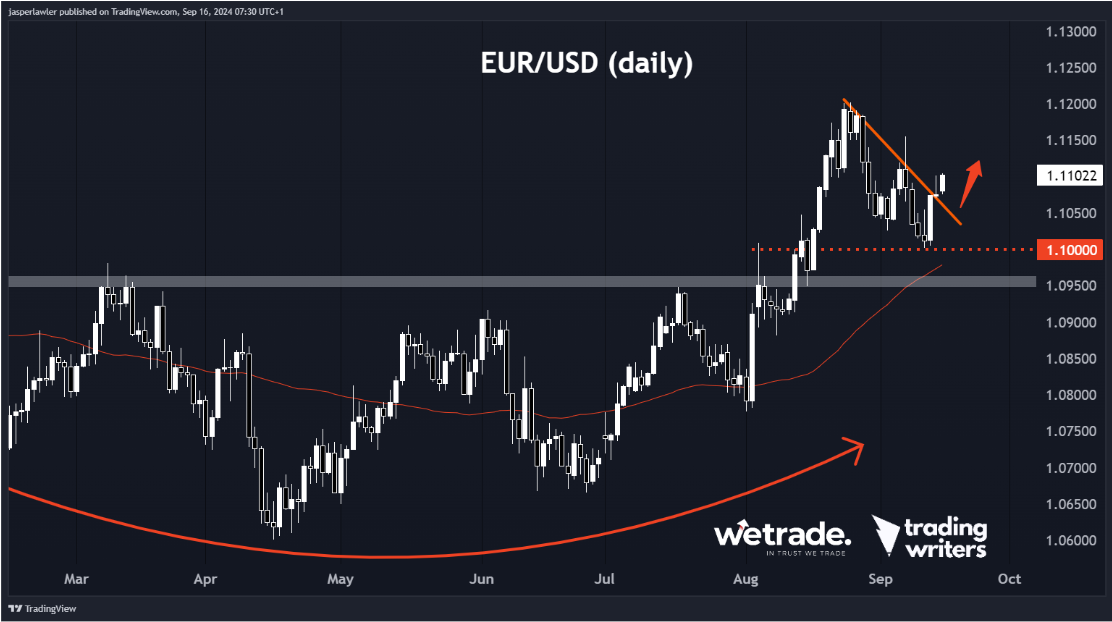
In the shorter term, EUR/USD appears to have completed a 200 pip pullback from 1.12 to 1.10.
If that’s the case - we are looking for a continuation move up and over 1.12 and for the bigger picture triangle breakout to extend further up to first 1.13 then possibly 1.17.
USD/JPY
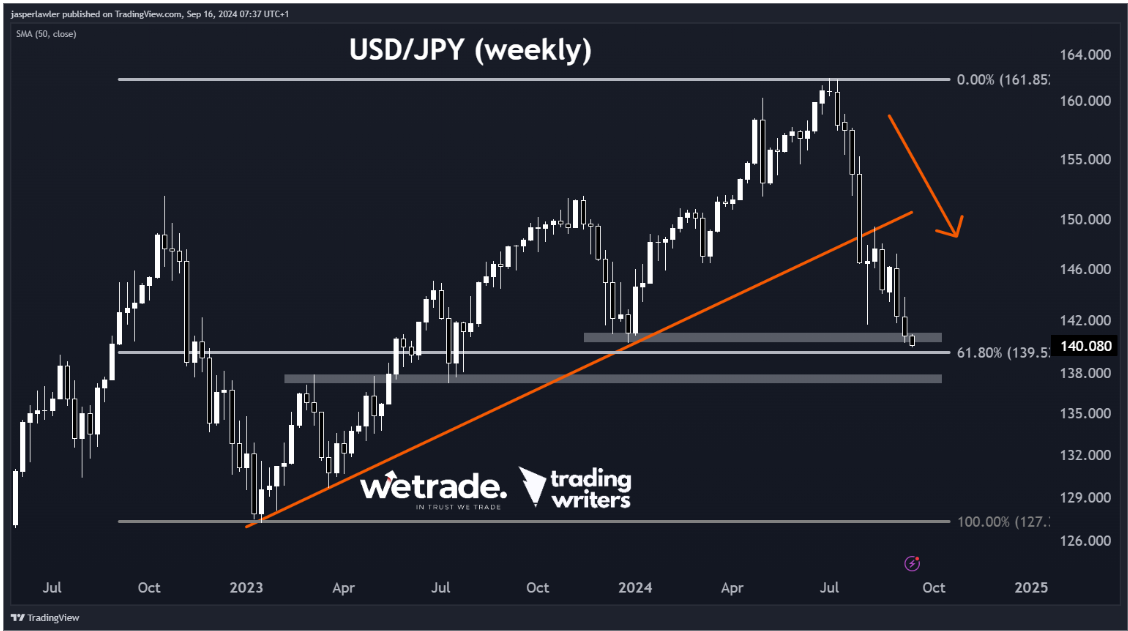
Again, no surprises here but the USD looks bearish.
Actually, USD/JPY has led the charge in USD bearishness in the past couple of months.
The bullish ‘pin bar’ (also called a hammer candlestick pattern) from 6 weeks ago has completely failed and the price continues to lower. Failed bullish patterns are very bearish!
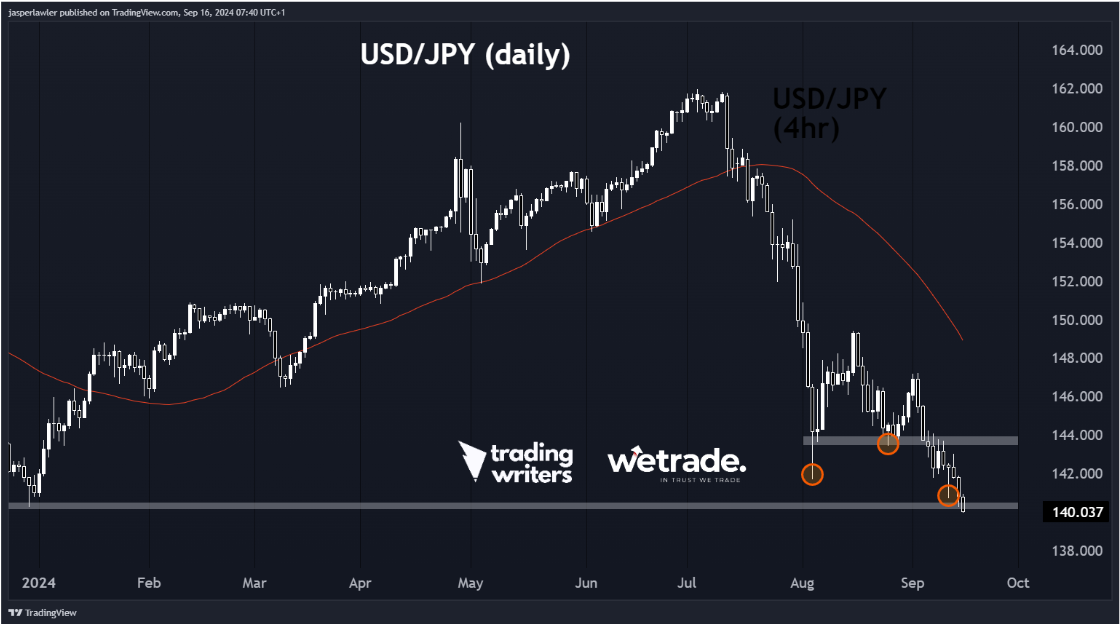
But we can’t ignore the major long-term support zone in the region of 138-142.
On the daily chart we can see the last of 2024’s gains being wiped out with a break below the December 2023 swing low.
To stay bearish - we need a deceive close below 140 - but that leaves us with poor risk: reward for new bearish positions.
As such, it's a waiting game for bullish pullbacks after the low is broken - or possibly buying the breakout of a bottoming pattern at major long-term support - but that won't happen for a while.
But that’s just what we think, do you agree or disagree?
Send us a message and let us know
Happy Trading!
Trade with WeTrade!
Every position closed is one step closer to unlocking WeTrade Honours privileges and redeeming exclusive rewards.
Start your trading journey here - Register now
Kickstart your trading of the week here - Login Now
Produced by Jasper and the Trading Writers team in collaboration with WeTrade.


