USD/JPY
One of the most dumbfounding concepts in trading is trend following.
We are big believers in following trends around here – but you do need to be a bit pragmatic about it.
This is where experience in the markets counts for a lot. Of course, you need to read the books and take the courses on how to trade but you really need screen time in front of the charts for it all to really hit home.
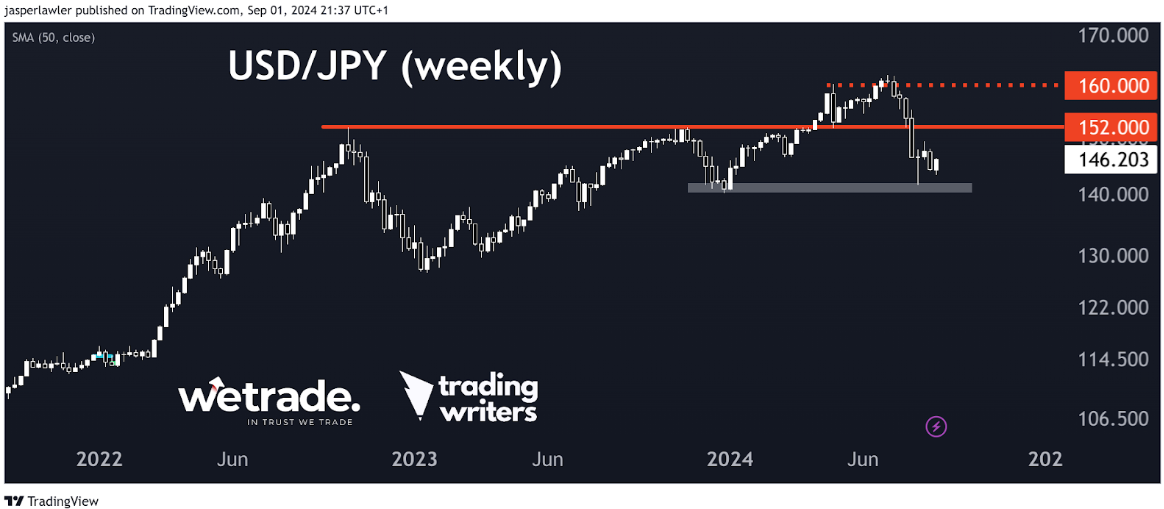
The trend in USD/JPY is down - and we think likely to stay down while below the former all-time highs at 152. As we see the situation - the move up to 160 and down was like a false breakout of 152.
However, a long-term downtrend will see multiple uptrends in lower time frames. These short-term uptrends normally happen when the price reaches long-term support.
This particular downtrend in USD/JPY stopped at 140.0 support. So yes, we want to sell in downtrends BUT not at support levels.
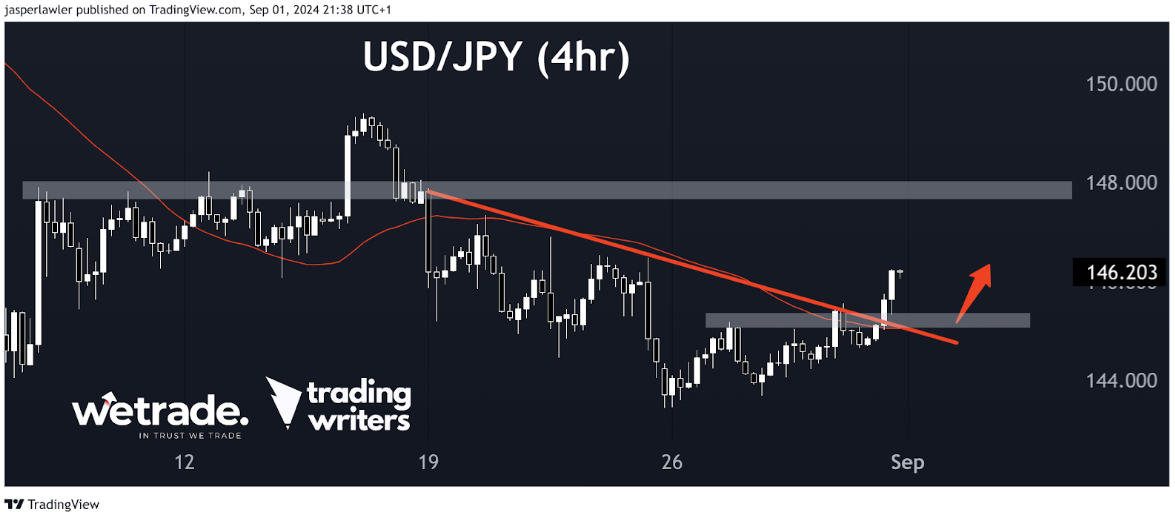
On the 4-hour chart, the downtrend has ended as shown by the move above the down trendline. There is a breakout higher which seems likely to target 148.
A drop down to the broken trendline/resistance presents a potential long trade opportunity - or for the more prudent among us, 148 presents an opportunity to rejoin the long-term downtrend at a more favourable level from the short side.
USD/CAD
When you go to parties, do you talk about forex? Do you talk about multi-year highs and lows and massive trends? If so, the ‘loonie’ probably doesn’t come up much in conversation.
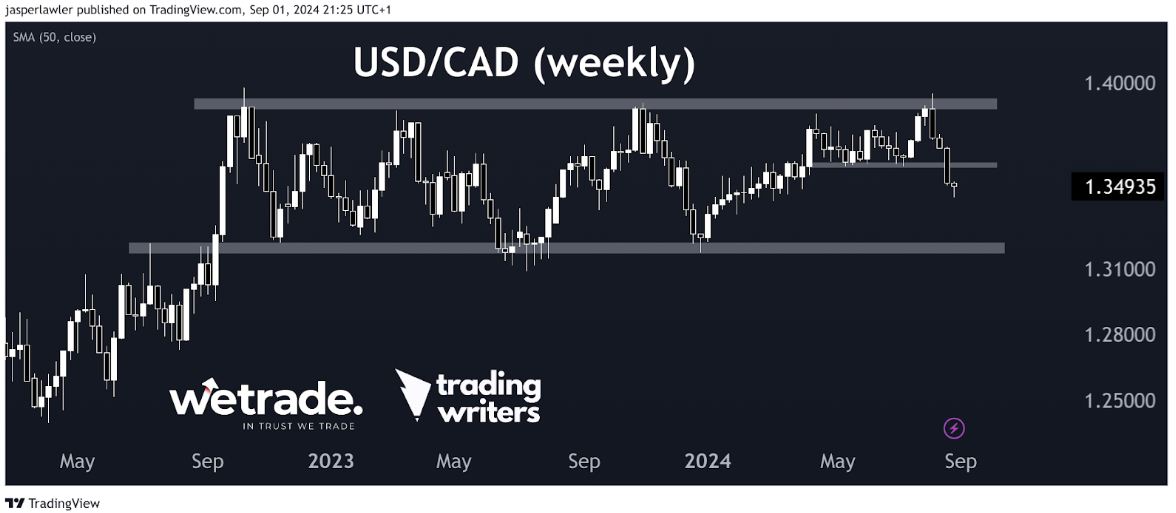
This thing has been in a trading range for 2 years. The high around 140 was in September 2022.
That high got rejected for a 4th time a month ago and the price has since dropped under support - which we now see as near-term resistance at 1.36.
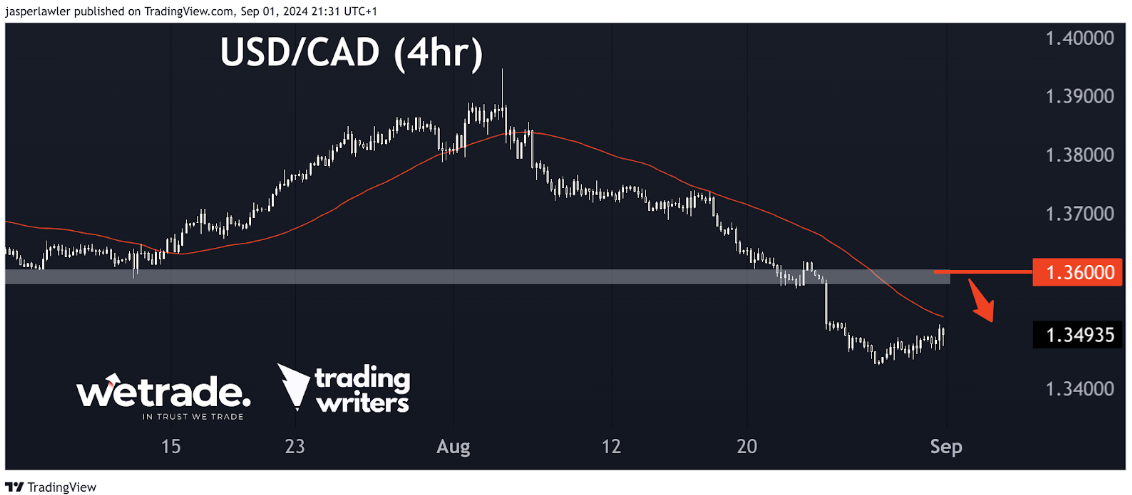
On the 4-hour timeframe you can see that 1.36 level a bit more clearly.
Again, we want to sell in downtrends but not right at the lows - we want better prices to sell i.e. after a rebound. A rebound might not happen - but if it does, we think it makes sense it would end at around 1.36.
A breakout over 1.36 carries the possibility of a 100% retracement right up to 1.39 - but should the downtrend continue - then 1.34 is next support.
DAX 40
Do you own a bunch of US tech stocks? You wouldn’t be the only one.
One place to get some diversification from tech stocks is Europe. Somehow Europe, including its biggest economy Germany, just doesn’t have too many cutting edge AI or internet companies.
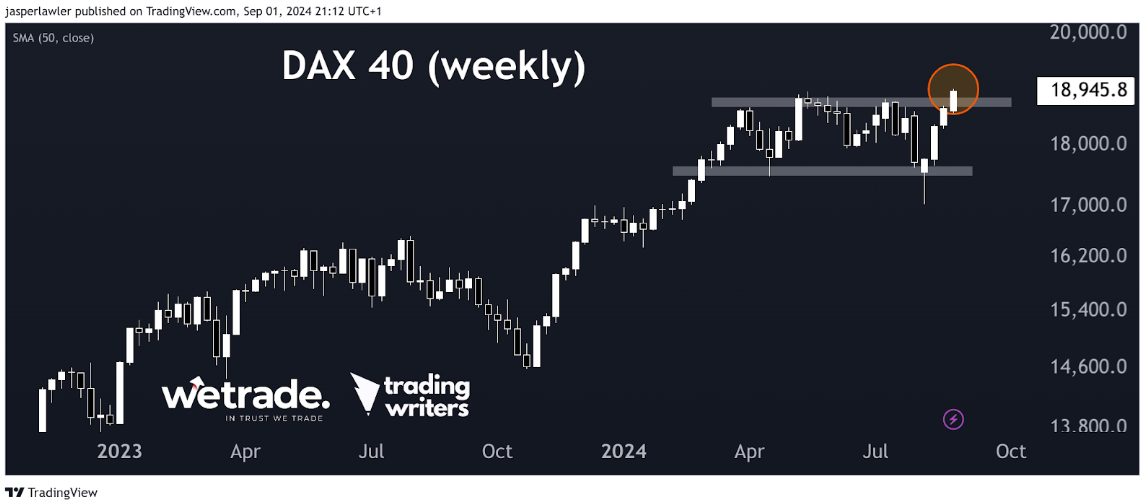
Maybe that’s a good thing right now - because Germany's benchmark stock index the DAX 40 is hitting record highs.
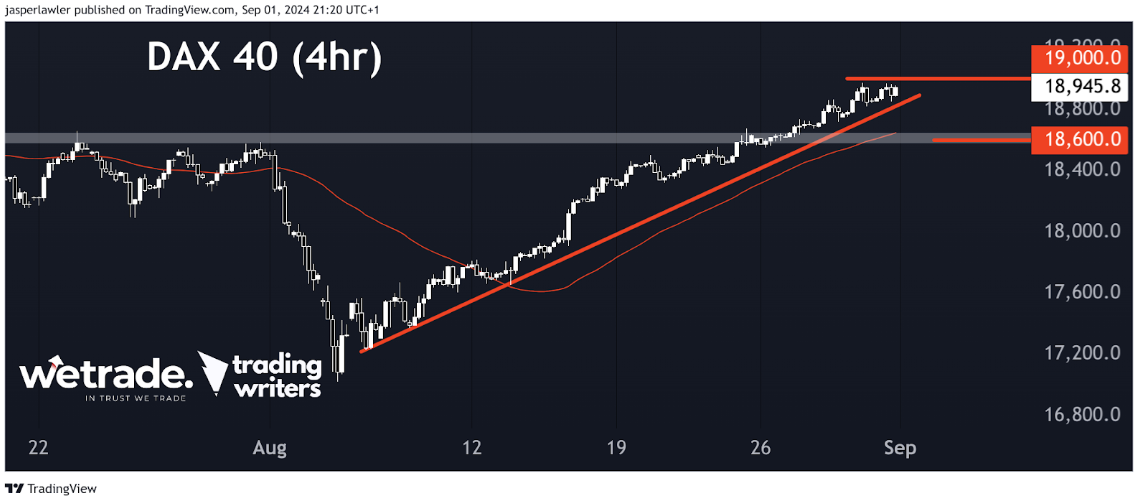
Naturally, when any market hits a record high - it’s not at bargain price levels on a historical basis. The uptrend in the 4-hour chart is pretty long in the tooth (a British phrase for being old!)
There has been a pause around 19,000 (ahead of the big 20,000 level!!). It seems only natural that this old uptrend should give back a little and 18,600 is the first level of support.
What do you think about our ideas? Do you agree/disagree?
Let us know by leaving a comment or by contacting client support.
Happy Trading!
Trade with WeTrade!
Every position closed is one step closer to unlocking WeTrade Honours privileges and redeeming exclusive rewards.
Start your trading journey here - Register now
Kickstart your trading of the week here - Login Now
Produced by Jasper and the Trading Writers team in collaboration with WeTrade.


