JPN 225
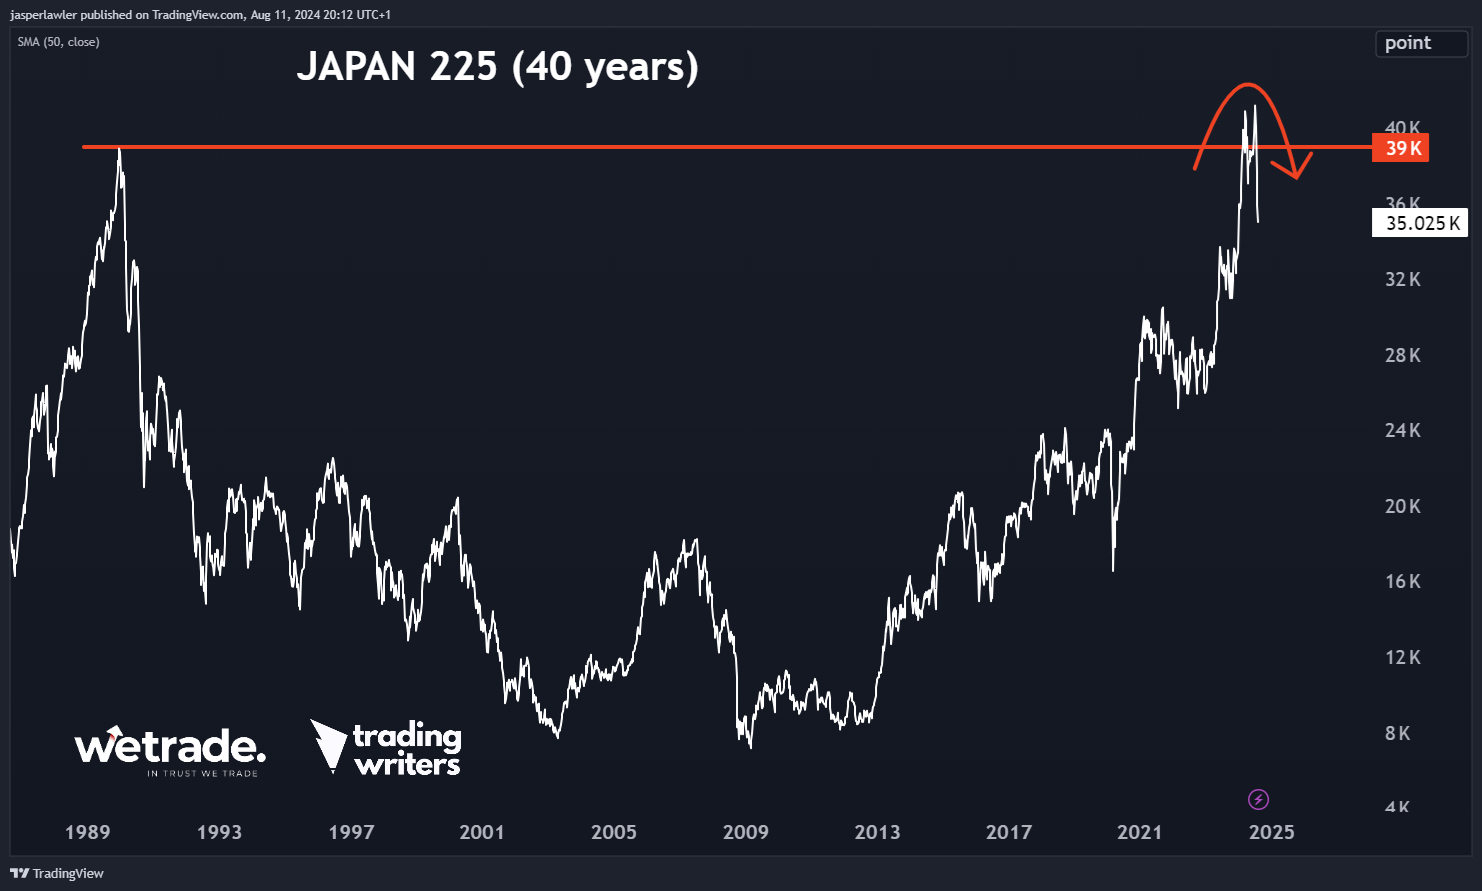
It’s not every week that the price of something reaches an all-time high for the first time in over 40 years.
Well that just happened to the Japanese stock market.
More specifically, the Nikkei 225 stock index, the benchmark for all the big blue chip Japanese companies, which is tradable as a CFD as JPN 225.
Now - we don’t usually go looking at 40 year charts. That’s because you don’t need to in order to make money trading these markets.
However - Japanese stocks led the losses in the big market sell-off last week - and this chart goes a long way to explaining why.
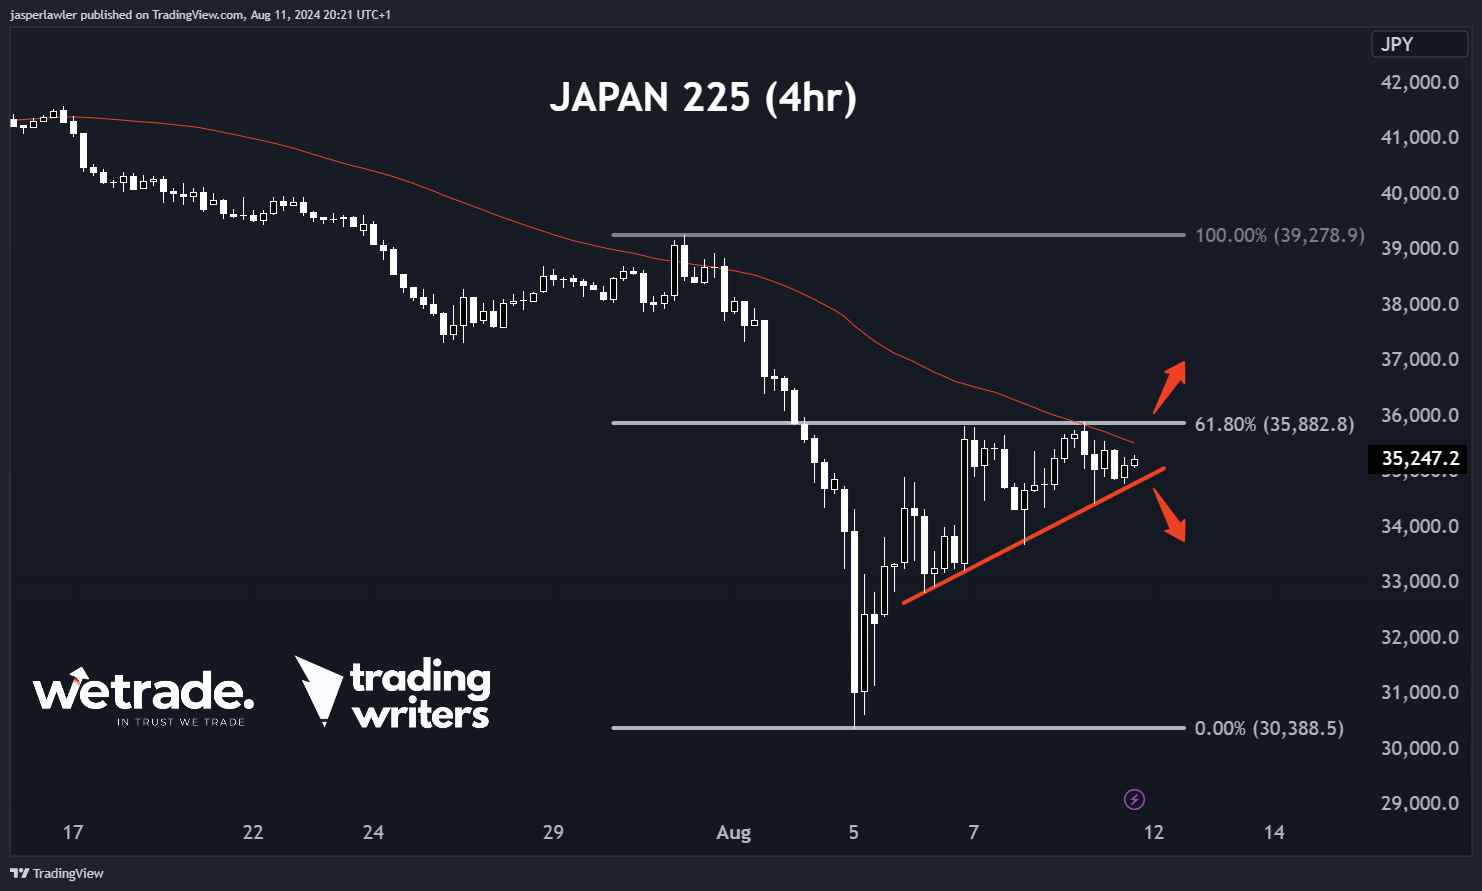
Taking a look at the shorter-term chart - this is not exactly the beginning of the downtrend!
JPN 225 is already down 25% from its high - from ~40,000 to ~30,000 is losing a quarter of its value.
That’s why we’d be happy to follow this downtrend lower with a break of the rising trendline signalled on the 4 hour chart.
OR we could equally believe this market has bottomed for now, with confirming from a breakout above 36,000 and the 61.8% Fibonacci retracement - with a full retracement up to 39,000 as a possible target.
EUR/USD
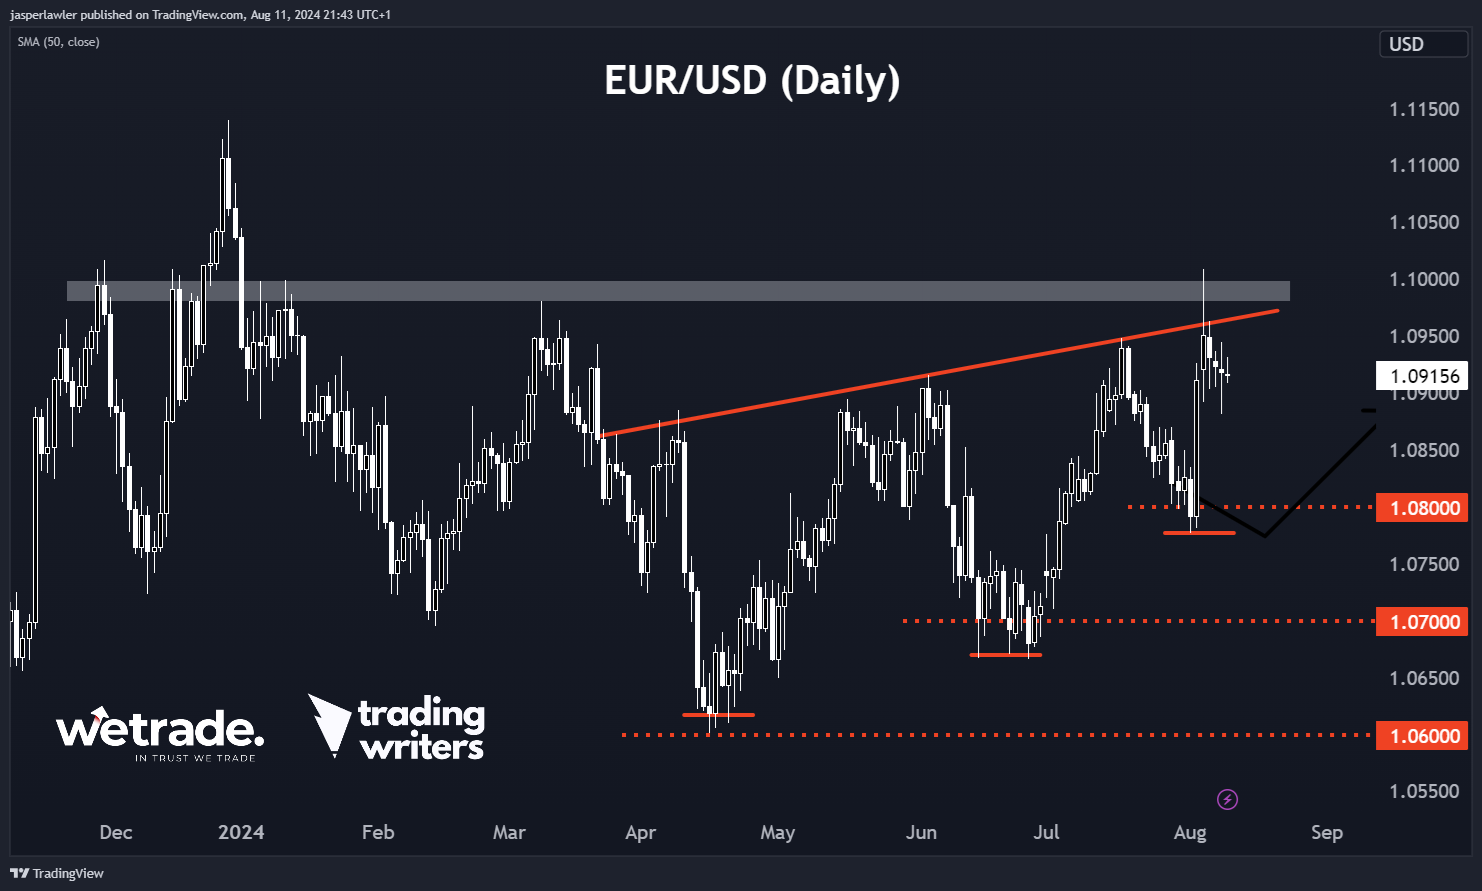
We said the other week “Frankly, for swing traders, there are better places out there to be trading than EUR/USD right now. That would all change with a breakout over 1.095-1.10.”
Well we didn’t get a breakout - we got a fakeout.
The price zoomed over 1.10 but closed the week back under 1.095 and the rising trendline connecting the last major swing highs. That means we are back in the trading range folks.
As such, we are technically still in a sideways range on the daily chart. However, the last two been ‘higher lows’ - suggesting the break is coming - just not yet.
For those looking to get ahead of the potential breakout scenario, the idea would be to pick the next swing low within the trading range.
If you think of this chart from the perspective of large speculators - it appears they first started buying in a 1.06 then the price rose and the got less interested and stopped buying - as the price dropped again, they started buying higher this time at 1.07 the price went up again - touched resistance at 1.095.
Then it followed the same pattern of 100 pip increments - and the next low came in at 1.08.
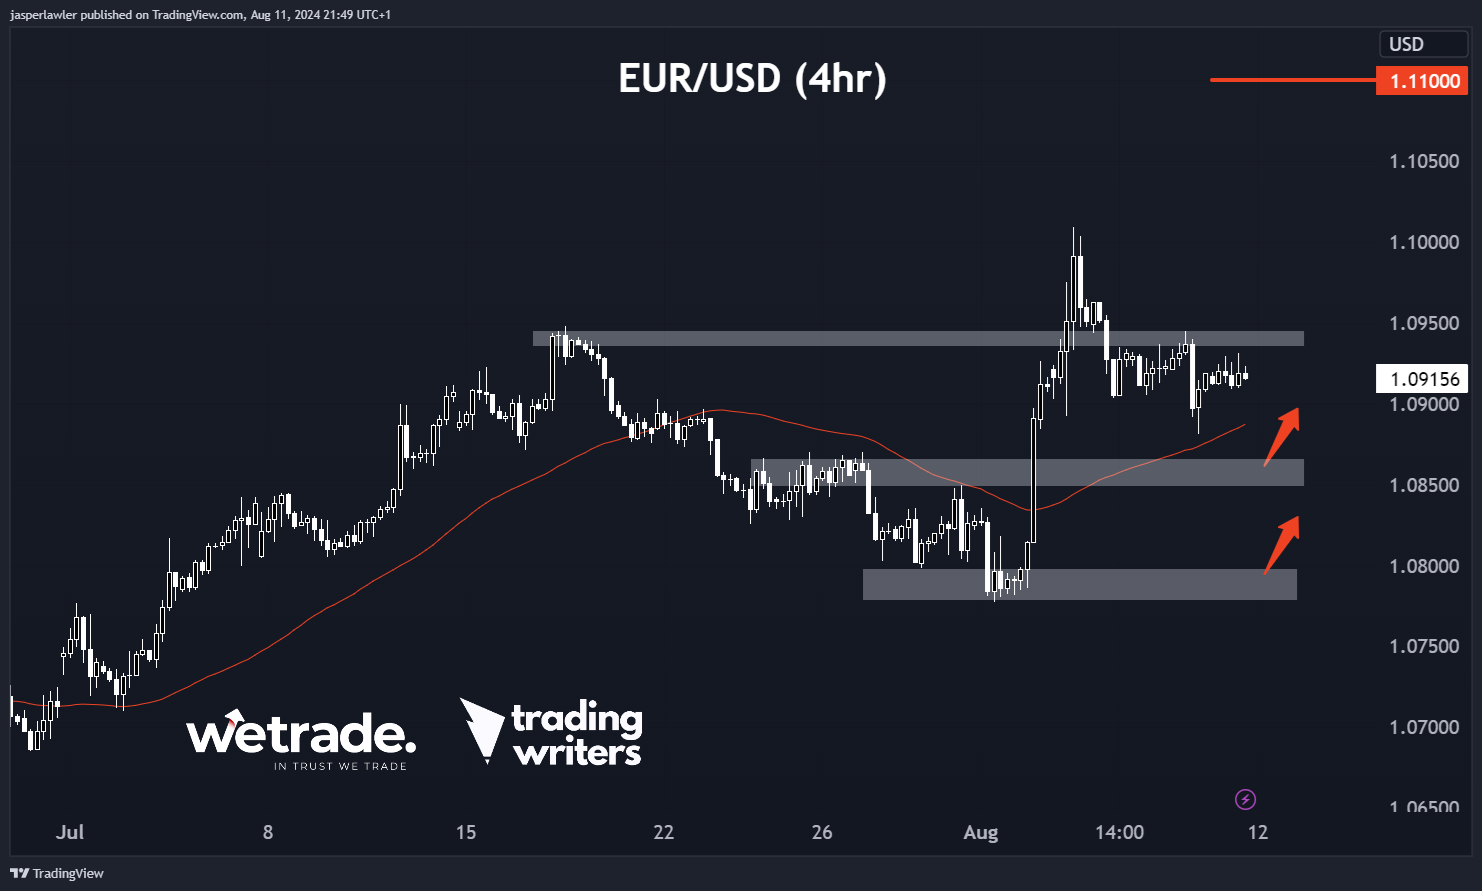
On the 4-hour chart, the price has already pulled back from 1.10 down to 1.09 (again 100 pips higher than the last major swing low).
If 1.09 was the low, we could look for a confirmation with a proper breakout back over the old resistance at 1.095.
We suspect that the large bearish reversal on the weekly chart might have spooked buyers a little - and there’s a chance the price drops back to 1.08 again with 1.085 another swing point to watch.
GBP/JPY
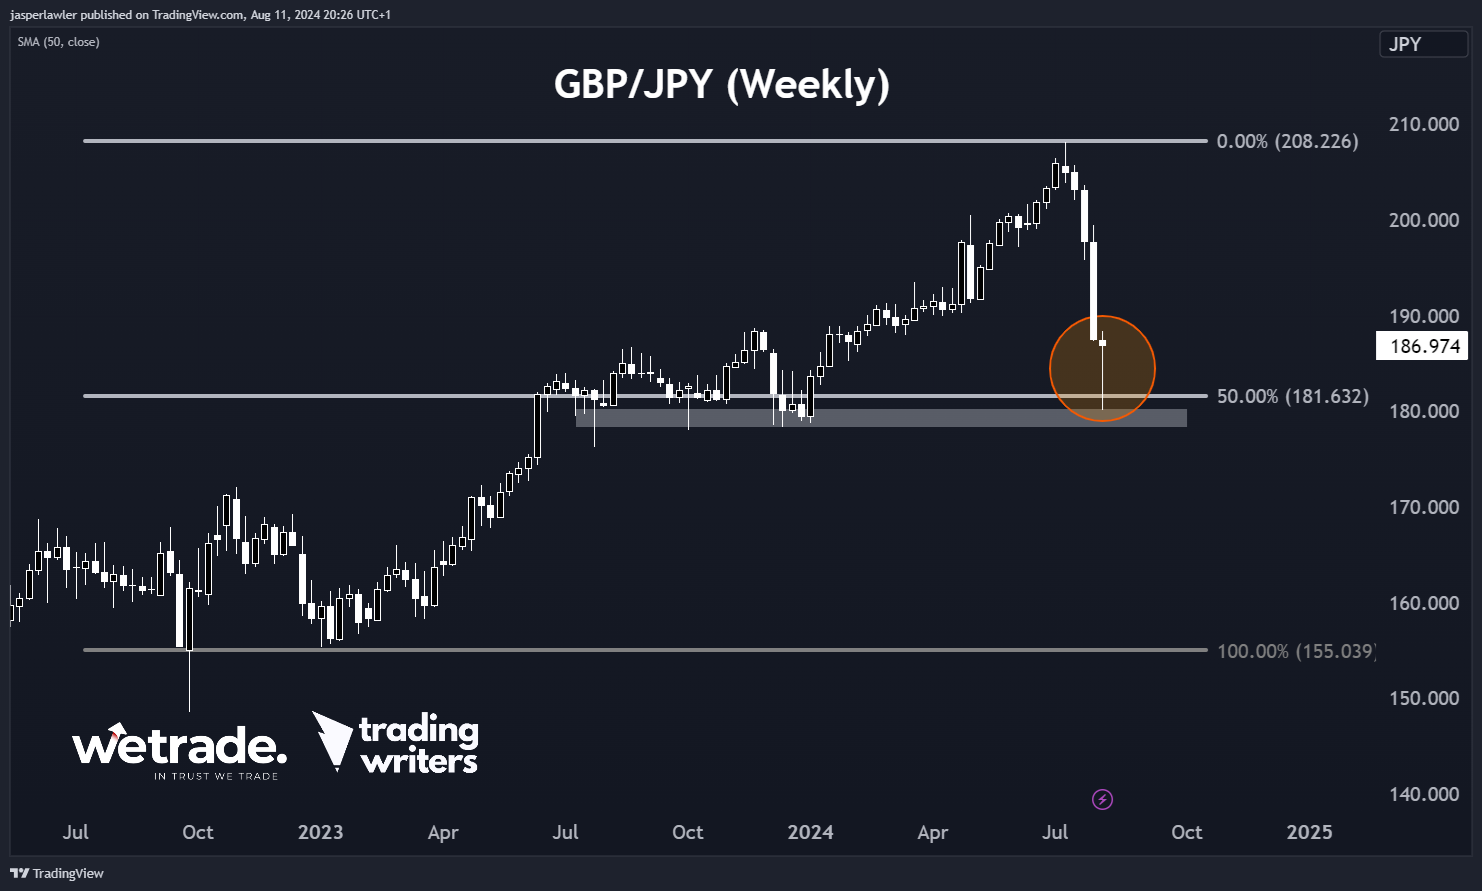
This my friends is a ‘pin bar’ pattern - in Japanese (appropriately here) it is a hammer pattern. But whatever you call it - it’s a bullish pattern.
Added to the bullishness is the confluence of support that triggered it. The 50% fibonacci retracement and the lows from the second half of 2023.
Of course the market can ignore this bullish signal - it does so all the time but this pattern has caught our attention enough to want to prefer short term long positions instead of short positions.
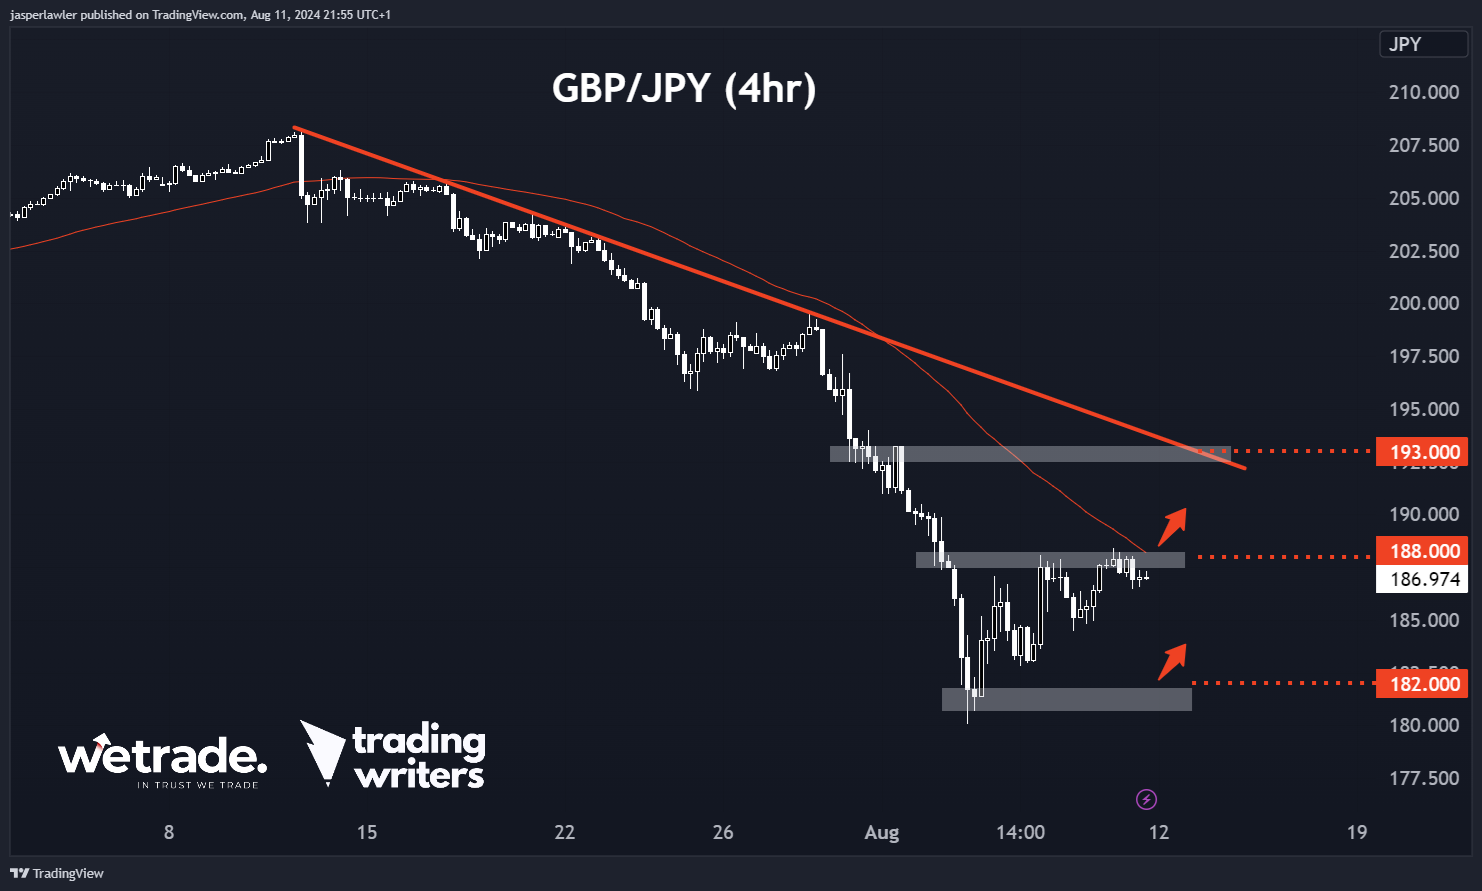
Dropping down to the 4-hour timeframe - we can better see the sharp downtrend that has made being a short-seller very profitable over the past month.
This downtrend is still technically in place - with the price only consolidating at the lows and still below the 50 period moving average and a downtrend line.
If the bullish pin bar/hammer is going to play out - opportunities to the long side could arise from a re-test of the lows at 182 or a breakout over resistance at 188.
What do you think about our ideas? Do you agree / disagree?
Let us know by leaving a comment or by contacting customer support.
Happy Trading!
Jasper, WeTrade Market Analyst and Founder of Trading Writers.
Trade with WeTrade!
Every position closed is one step closer to unlocking WeTrade Honours privileges and redeeming exclusive rewards.
Start your trading journey here - Register now
Kickstart your trading of the week here - Login Now
Produced by Jasper and the Trading Writers team in collaboration with WeTrade.
As a part of our 9th-anniversary celebration, we're giving away up to 90,000 USD in cashback from 1 to 31 August 2024. New clients will receive 2 USD cashback for every standard lot traded, subject to a maximum of 60,000 USD. Meanwhile, existing clients can earn 2 additional Reward Points per traded lot, capped at 30,000 Reward Points.
Additionally, you can unlock up to 30,000 USD in tiered cash reward packages too! For more information, see here.
Posted on 12 August 2024 at 10:00 AM


